Belizean vs Immigrants from Ethiopia In Labor Force | Age 20-64
COMPARE
Belizean
Immigrants from Ethiopia
In Labor Force | Age 20-64
In Labor Force | Age 20-64 Comparison
Belizeans
Immigrants from Ethiopia
78.2%
IN LABOR FORCE | AGE 20-64
0.0/ 100
METRIC RATING
279th/ 347
METRIC RANK
82.1%
IN LABOR FORCE | AGE 20-64
100.0/ 100
METRIC RATING
1st/ 347
METRIC RANK
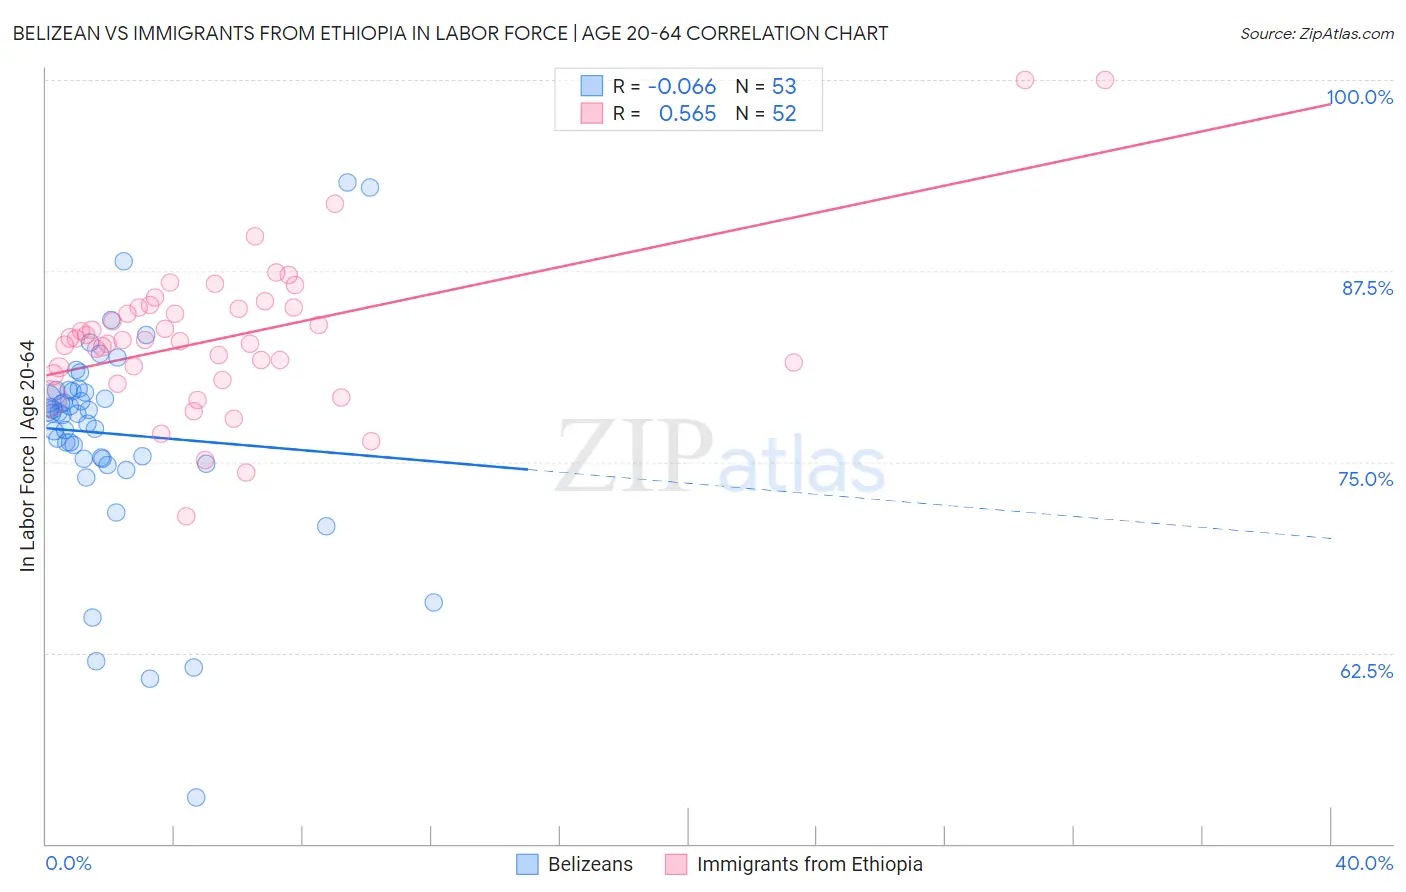
Belizean vs Immigrants from Ethiopia In Labor Force | Age 20-64 Correlation Chart
The statistical analysis conducted on geographies consisting of 144,213,246 people shows a slight negative correlation between the proportion of Belizeans and labor force participation rate among population between the ages 20 and 64 in the United States with a correlation coefficient (R) of -0.066 and weighted average of 78.2%. Similarly, the statistical analysis conducted on geographies consisting of 211,573,899 people shows a substantial positive correlation between the proportion of Immigrants from Ethiopia and labor force participation rate among population between the ages 20 and 64 in the United States with a correlation coefficient (R) of 0.565 and weighted average of 82.1%, a difference of 5.0%.
In Labor Force | Age 20-64 Correlation Summary
| Measurement | Belizean | Immigrants from Ethiopia |
| Minimum | 53.0% | 71.4% |
| Maximum | 93.3% | 100.0% |
| Range | 40.3% | 28.6% |
| Mean | 76.8% | 83.2% |
| Median | 78.2% | 83.0% |
| Interquartile 25% (IQ1) | 75.2% | 81.0% |
| Interquartile 75% (IQ3) | 79.7% | 85.1% |
| Interquartile Range (IQR) | 4.5% | 4.1% |
| Standard Deviation (Sample) | 7.1% | 5.1% |
| Standard Deviation (Population) | 7.0% | 5.0% |
Similar Demographics by In Labor Force | Age 20-64
Demographics Similar to Belizeans by In Labor Force | Age 20-64
In terms of in labor force | age 20-64, the demographic groups most similar to Belizeans are Immigrants from Dominica (78.1%, a difference of 0.040%), Mexican American Indian (78.2%, a difference of 0.050%), Immigrants from Bahamas (78.2%, a difference of 0.060%), Spanish (78.2%, a difference of 0.070%), and Puget Sound Salish (78.2%, a difference of 0.070%).
| Demographics | Rating | Rank | In Labor Force | Age 20-64 |
| Marshallese | 0.0 /100 | #272 | Tragic 78.3% |
| French American Indians | 0.0 /100 | #273 | Tragic 78.2% |
| Aleuts | 0.0 /100 | #274 | Tragic 78.2% |
| Spanish | 0.0 /100 | #275 | Tragic 78.2% |
| Puget Sound Salish | 0.0 /100 | #276 | Tragic 78.2% |
| Immigrants | Bahamas | 0.0 /100 | #277 | Tragic 78.2% |
| Mexican American Indians | 0.0 /100 | #278 | Tragic 78.2% |
| Belizeans | 0.0 /100 | #279 | Tragic 78.2% |
| Immigrants | Dominica | 0.0 /100 | #280 | Tragic 78.1% |
| Guyanese | 0.0 /100 | #281 | Tragic 78.1% |
| Immigrants | St. Vincent and the Grenadines | 0.0 /100 | #282 | Tragic 78.1% |
| Immigrants | Nonimmigrants | 0.0 /100 | #283 | Tragic 78.1% |
| Immigrants | Guyana | 0.0 /100 | #284 | Tragic 78.1% |
| Osage | 0.0 /100 | #285 | Tragic 78.0% |
| Immigrants | Belize | 0.0 /100 | #286 | Tragic 78.0% |
Demographics Similar to Immigrants from Ethiopia by In Labor Force | Age 20-64
In terms of in labor force | age 20-64, the demographic groups most similar to Immigrants from Ethiopia are Ethiopian (82.0%, a difference of 0.12%), Immigrants from Bolivia (81.9%, a difference of 0.13%), Luxembourger (81.9%, a difference of 0.25%), Bolivian (81.7%, a difference of 0.45%), and Somali (81.6%, a difference of 0.56%).
| Demographics | Rating | Rank | In Labor Force | Age 20-64 |
| Immigrants | Ethiopia | 100.0 /100 | #1 | Exceptional 82.1% |
| Ethiopians | 100.0 /100 | #2 | Exceptional 82.0% |
| Immigrants | Bolivia | 100.0 /100 | #3 | Exceptional 81.9% |
| Luxembourgers | 100.0 /100 | #4 | Exceptional 81.9% |
| Bolivians | 100.0 /100 | #5 | Exceptional 81.7% |
| Somalis | 100.0 /100 | #6 | Exceptional 81.6% |
| Immigrants | Cameroon | 100.0 /100 | #7 | Exceptional 81.6% |
| Immigrants | Somalia | 100.0 /100 | #8 | Exceptional 81.6% |
| Sierra Leoneans | 100.0 /100 | #9 | Exceptional 81.5% |
| Immigrants | Sierra Leone | 100.0 /100 | #10 | Exceptional 81.5% |
| Immigrants | Eastern Africa | 100.0 /100 | #11 | Exceptional 81.3% |
| Immigrants | Eritrea | 100.0 /100 | #12 | Exceptional 81.3% |
| Immigrants | India | 100.0 /100 | #13 | Exceptional 81.3% |
| Cambodians | 100.0 /100 | #14 | Exceptional 81.1% |
| Bulgarians | 100.0 /100 | #15 | Exceptional 81.1% |