Immigrants from Eastern Asia vs Barbadian Median Female Earnings
COMPARE
Immigrants from Eastern Asia
Barbadian
Median Female Earnings
Median Female Earnings Comparison
Immigrants from Eastern Asia
Barbadians
$46,502
MEDIAN FEMALE EARNINGS
100.0/ 100
METRIC RATING
15th/ 347
METRIC RANK
$41,261
MEDIAN FEMALE EARNINGS
96.3/ 100
METRIC RATING
117th/ 347
METRIC RANK
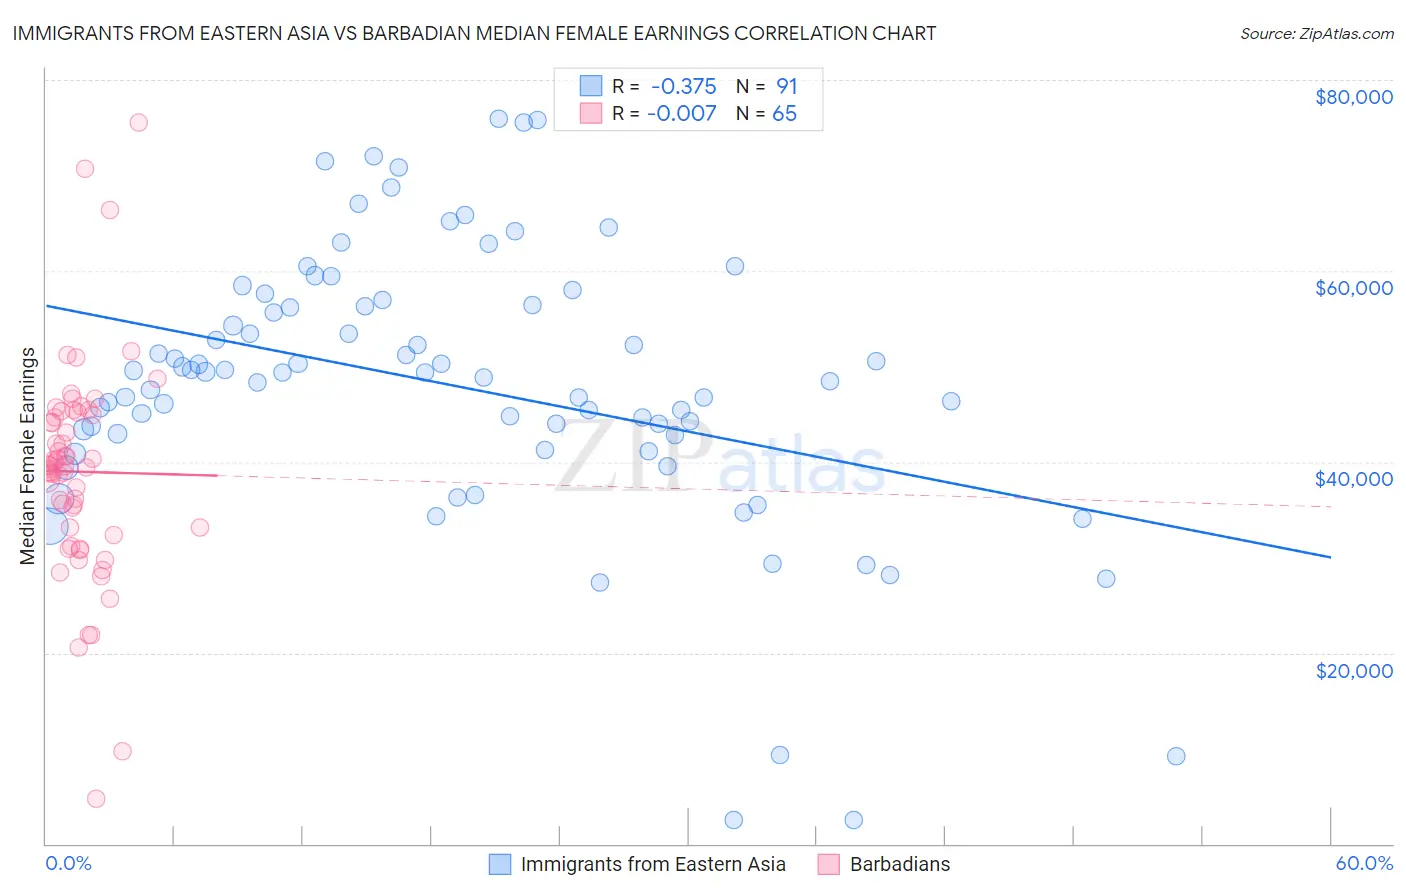
Immigrants from Eastern Asia vs Barbadian Median Female Earnings Correlation Chart
The statistical analysis conducted on geographies consisting of 499,525,371 people shows a mild negative correlation between the proportion of Immigrants from Eastern Asia and median female earnings in the United States with a correlation coefficient (R) of -0.375 and weighted average of $46,502. Similarly, the statistical analysis conducted on geographies consisting of 141,295,506 people shows no correlation between the proportion of Barbadians and median female earnings in the United States with a correlation coefficient (R) of -0.007 and weighted average of $41,261, a difference of 12.7%.
Median Female Earnings Correlation Summary
| Measurement | Immigrants from Eastern Asia | Barbadian |
| Minimum | $2,499 | $4,682 |
| Maximum | $75,958 | $75,551 |
| Range | $73,459 | $70,869 |
| Mean | $48,076 | $38,965 |
| Median | $49,327 | $39,507 |
| Interquartile 25% (IQ1) | $42,770 | $32,736 |
| Interquartile 75% (IQ3) | $56,452 | $45,058 |
| Interquartile Range (IQR) | $13,682 | $12,323 |
| Standard Deviation (Sample) | $14,424 | $11,409 |
| Standard Deviation (Population) | $14,344 | $11,321 |
Similar Demographics by Median Female Earnings
Demographics Similar to Immigrants from Eastern Asia by Median Female Earnings
In terms of median female earnings, the demographic groups most similar to Immigrants from Eastern Asia are Indian (Asian) ($46,481, a difference of 0.050%), Soviet Union ($46,556, a difference of 0.11%), Immigrants from Australia ($46,573, a difference of 0.15%), Immigrants from South Central Asia ($46,324, a difference of 0.39%), and Immigrants from Israel ($46,902, a difference of 0.86%).
| Demographics | Rating | Rank | Median Female Earnings |
| Iranians | 100.0 /100 | #8 | Exceptional $47,421 |
| Immigrants | Iran | 100.0 /100 | #9 | Exceptional $47,154 |
| Immigrants | China | 100.0 /100 | #10 | Exceptional $46,972 |
| Okinawans | 100.0 /100 | #11 | Exceptional $46,905 |
| Immigrants | Israel | 100.0 /100 | #12 | Exceptional $46,902 |
| Immigrants | Australia | 100.0 /100 | #13 | Exceptional $46,573 |
| Soviet Union | 100.0 /100 | #14 | Exceptional $46,556 |
| Immigrants | Eastern Asia | 100.0 /100 | #15 | Exceptional $46,502 |
| Indians (Asian) | 100.0 /100 | #16 | Exceptional $46,481 |
| Immigrants | South Central Asia | 100.0 /100 | #17 | Exceptional $46,324 |
| Cypriots | 100.0 /100 | #18 | Exceptional $45,570 |
| Eastern Europeans | 100.0 /100 | #19 | Exceptional $45,385 |
| Immigrants | Japan | 100.0 /100 | #20 | Exceptional $45,323 |
| Cambodians | 100.0 /100 | #21 | Exceptional $45,014 |
| Immigrants | Greece | 100.0 /100 | #22 | Exceptional $44,976 |
Demographics Similar to Barbadians by Median Female Earnings
In terms of median female earnings, the demographic groups most similar to Barbadians are Immigrants from Brazil ($41,273, a difference of 0.030%), Immigrants from England ($41,277, a difference of 0.040%), Korean ($41,276, a difference of 0.040%), Macedonian ($41,286, a difference of 0.060%), and Immigrants from North America ($41,319, a difference of 0.14%).
| Demographics | Rating | Rank | Median Female Earnings |
| Immigrants | Western Asia | 97.0 /100 | #110 | Exceptional $41,375 |
| Immigrants | Canada | 97.0 /100 | #111 | Exceptional $41,373 |
| Immigrants | North America | 96.7 /100 | #112 | Exceptional $41,319 |
| Macedonians | 96.4 /100 | #113 | Exceptional $41,286 |
| Immigrants | England | 96.4 /100 | #114 | Exceptional $41,277 |
| Koreans | 96.4 /100 | #115 | Exceptional $41,276 |
| Immigrants | Brazil | 96.4 /100 | #116 | Exceptional $41,273 |
| Barbadians | 96.3 /100 | #117 | Exceptional $41,261 |
| Immigrants | Lebanon | 95.6 /100 | #118 | Exceptional $41,183 |
| Immigrants | Philippines | 95.0 /100 | #119 | Exceptional $41,114 |
| Immigrants | Kuwait | 94.4 /100 | #120 | Exceptional $41,055 |
| Croatians | 93.7 /100 | #121 | Exceptional $40,993 |
| Immigrants | Jordan | 93.5 /100 | #122 | Exceptional $40,977 |
| Guyanese | 93.4 /100 | #123 | Exceptional $40,973 |
| Trinidadians and Tobagonians | 93.2 /100 | #124 | Exceptional $40,958 |