Fijian vs Barbadian Median Female Earnings
COMPARE
Fijian
Barbadian
Median Female Earnings
Median Female Earnings Comparison
Fijians
Barbadians
$35,114
MEDIAN FEMALE EARNINGS
0.0/ 100
METRIC RATING
306th/ 347
METRIC RANK
$41,261
MEDIAN FEMALE EARNINGS
96.3/ 100
METRIC RATING
117th/ 347
METRIC RANK
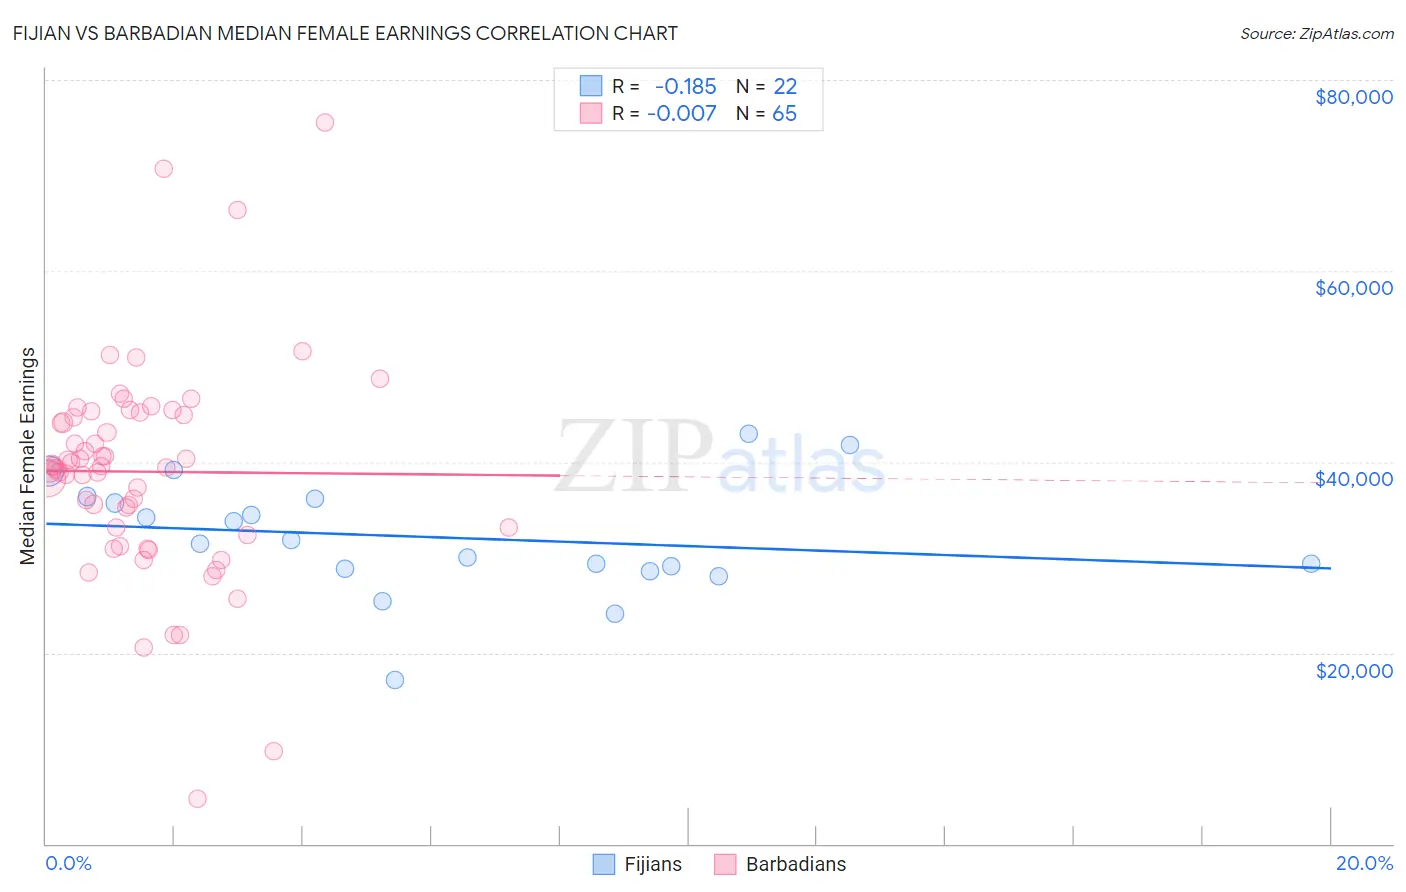
Fijian vs Barbadian Median Female Earnings Correlation Chart
The statistical analysis conducted on geographies consisting of 55,944,407 people shows a poor negative correlation between the proportion of Fijians and median female earnings in the United States with a correlation coefficient (R) of -0.185 and weighted average of $35,114. Similarly, the statistical analysis conducted on geographies consisting of 141,295,506 people shows no correlation between the proportion of Barbadians and median female earnings in the United States with a correlation coefficient (R) of -0.007 and weighted average of $41,261, a difference of 17.5%.
Median Female Earnings Correlation Summary
| Measurement | Fijian | Barbadian |
| Minimum | $17,125 | $4,682 |
| Maximum | $42,895 | $75,551 |
| Range | $25,770 | $70,869 |
| Mean | $32,097 | $38,965 |
| Median | $31,625 | $39,507 |
| Interquartile 25% (IQ1) | $28,766 | $32,736 |
| Interquartile 75% (IQ3) | $36,076 | $45,058 |
| Interquartile Range (IQR) | $7,310 | $12,323 |
| Standard Deviation (Sample) | $6,055 | $11,409 |
| Standard Deviation (Population) | $5,916 | $11,321 |
Similar Demographics by Median Female Earnings
Demographics Similar to Fijians by Median Female Earnings
In terms of median female earnings, the demographic groups most similar to Fijians are Bahamian ($35,125, a difference of 0.030%), Sioux ($35,063, a difference of 0.15%), Immigrants from Bahamas ($35,027, a difference of 0.25%), Honduran ($35,013, a difference of 0.29%), and Chippewa ($35,003, a difference of 0.32%).
| Demographics | Rating | Rank | Median Female Earnings |
| Immigrants | Guatemala | 0.0 /100 | #299 | Tragic $35,444 |
| Yuman | 0.0 /100 | #300 | Tragic $35,377 |
| Pima | 0.0 /100 | #301 | Tragic $35,326 |
| Blacks/African Americans | 0.0 /100 | #302 | Tragic $35,315 |
| Immigrants | Latin America | 0.0 /100 | #303 | Tragic $35,307 |
| Crow | 0.0 /100 | #304 | Tragic $35,266 |
| Bahamians | 0.0 /100 | #305 | Tragic $35,125 |
| Fijians | 0.0 /100 | #306 | Tragic $35,114 |
| Sioux | 0.0 /100 | #307 | Tragic $35,063 |
| Immigrants | Bahamas | 0.0 /100 | #308 | Tragic $35,027 |
| Hondurans | 0.0 /100 | #309 | Tragic $35,013 |
| Chippewa | 0.0 /100 | #310 | Tragic $35,003 |
| Ute | 0.0 /100 | #311 | Tragic $34,960 |
| Yaqui | 0.0 /100 | #312 | Tragic $34,943 |
| Cubans | 0.0 /100 | #313 | Tragic $34,942 |
Demographics Similar to Barbadians by Median Female Earnings
In terms of median female earnings, the demographic groups most similar to Barbadians are Immigrants from Brazil ($41,273, a difference of 0.030%), Immigrants from England ($41,277, a difference of 0.040%), Korean ($41,276, a difference of 0.040%), Macedonian ($41,286, a difference of 0.060%), and Immigrants from North America ($41,319, a difference of 0.14%).
| Demographics | Rating | Rank | Median Female Earnings |
| Immigrants | Western Asia | 97.0 /100 | #110 | Exceptional $41,375 |
| Immigrants | Canada | 97.0 /100 | #111 | Exceptional $41,373 |
| Immigrants | North America | 96.7 /100 | #112 | Exceptional $41,319 |
| Macedonians | 96.4 /100 | #113 | Exceptional $41,286 |
| Immigrants | England | 96.4 /100 | #114 | Exceptional $41,277 |
| Koreans | 96.4 /100 | #115 | Exceptional $41,276 |
| Immigrants | Brazil | 96.4 /100 | #116 | Exceptional $41,273 |
| Barbadians | 96.3 /100 | #117 | Exceptional $41,261 |
| Immigrants | Lebanon | 95.6 /100 | #118 | Exceptional $41,183 |
| Immigrants | Philippines | 95.0 /100 | #119 | Exceptional $41,114 |
| Immigrants | Kuwait | 94.4 /100 | #120 | Exceptional $41,055 |
| Croatians | 93.7 /100 | #121 | Exceptional $40,993 |
| Immigrants | Jordan | 93.5 /100 | #122 | Exceptional $40,977 |
| Guyanese | 93.4 /100 | #123 | Exceptional $40,973 |
| Trinidadians and Tobagonians | 93.2 /100 | #124 | Exceptional $40,958 |