Somali vs Barbadian Median Female Earnings
COMPARE
Somali
Barbadian
Median Female Earnings
Median Female Earnings Comparison
Somalis
Barbadians
$38,333
MEDIAN FEMALE EARNINGS
5.5/ 100
METRIC RATING
231st/ 347
METRIC RANK
$41,261
MEDIAN FEMALE EARNINGS
96.3/ 100
METRIC RATING
117th/ 347
METRIC RANK
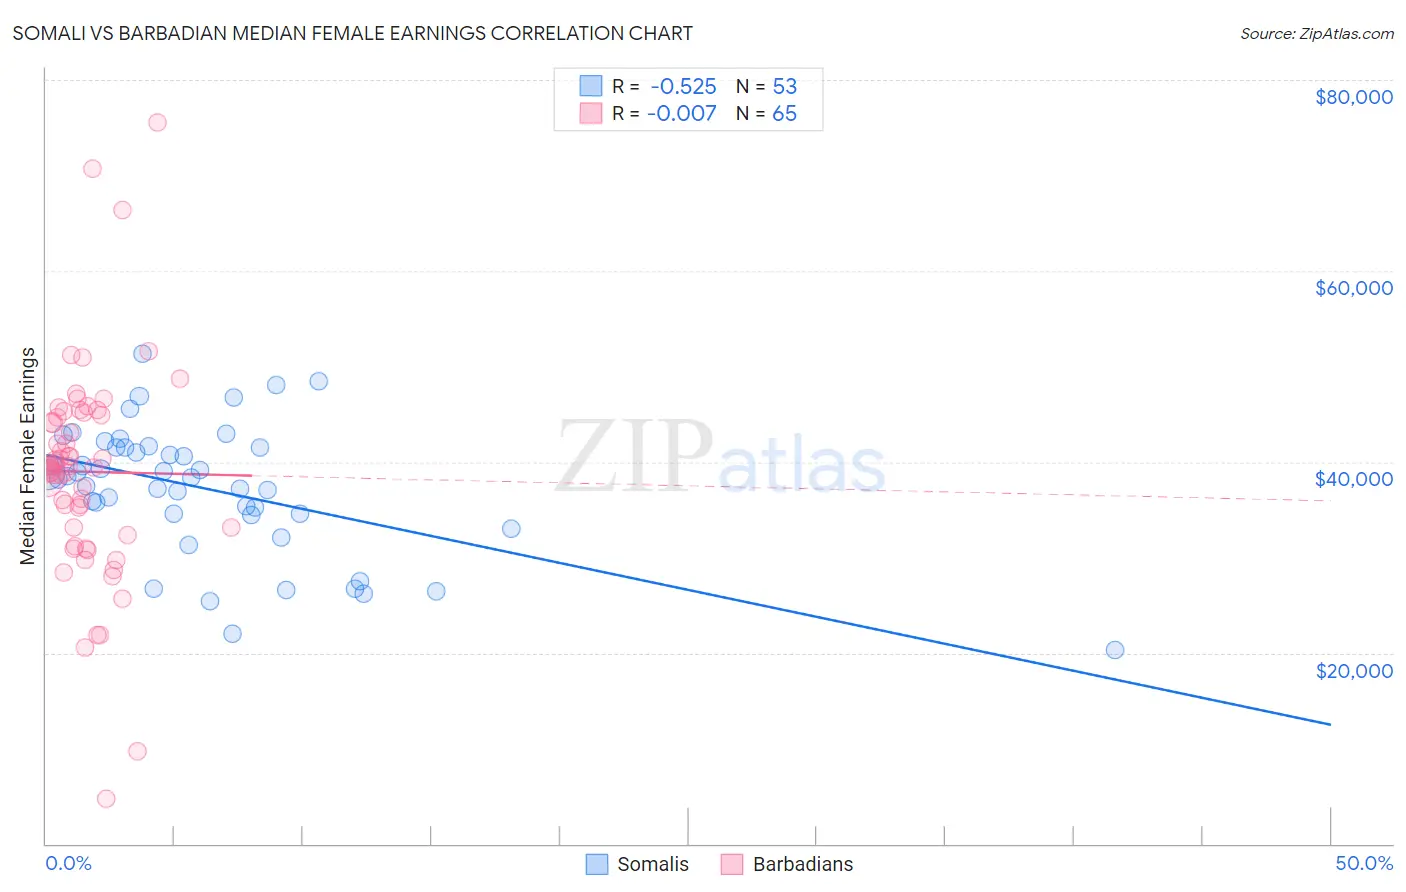
Somali vs Barbadian Median Female Earnings Correlation Chart
The statistical analysis conducted on geographies consisting of 99,326,973 people shows a substantial negative correlation between the proportion of Somalis and median female earnings in the United States with a correlation coefficient (R) of -0.525 and weighted average of $38,333. Similarly, the statistical analysis conducted on geographies consisting of 141,295,506 people shows no correlation between the proportion of Barbadians and median female earnings in the United States with a correlation coefficient (R) of -0.007 and weighted average of $41,261, a difference of 7.6%.
Median Female Earnings Correlation Summary
| Measurement | Somali | Barbadian |
| Minimum | $20,281 | $4,682 |
| Maximum | $51,368 | $75,551 |
| Range | $31,087 | $70,869 |
| Mean | $37,176 | $38,965 |
| Median | $38,333 | $39,507 |
| Interquartile 25% (IQ1) | $34,463 | $32,736 |
| Interquartile 75% (IQ3) | $41,523 | $45,058 |
| Interquartile Range (IQR) | $7,060 | $12,323 |
| Standard Deviation (Sample) | $6,829 | $11,409 |
| Standard Deviation (Population) | $6,765 | $11,321 |
Similar Demographics by Median Female Earnings
Demographics Similar to Somalis by Median Female Earnings
In terms of median female earnings, the demographic groups most similar to Somalis are Basque ($38,352, a difference of 0.050%), Scandinavian ($38,306, a difference of 0.070%), Tongan ($38,288, a difference of 0.12%), Belgian ($38,382, a difference of 0.13%), and Celtic ($38,283, a difference of 0.13%).
| Demographics | Rating | Rank | Median Female Earnings |
| Native Hawaiians | 7.1 /100 | #224 | Tragic $38,461 |
| French | 7.0 /100 | #225 | Tragic $38,457 |
| French Canadians | 6.8 /100 | #226 | Tragic $38,436 |
| Scottish | 6.3 /100 | #227 | Tragic $38,397 |
| Sub-Saharan Africans | 6.2 /100 | #228 | Tragic $38,391 |
| Belgians | 6.1 /100 | #229 | Tragic $38,382 |
| Basques | 5.7 /100 | #230 | Tragic $38,352 |
| Somalis | 5.5 /100 | #231 | Tragic $38,333 |
| Scandinavians | 5.2 /100 | #232 | Tragic $38,306 |
| Tongans | 5.1 /100 | #233 | Tragic $38,288 |
| Celtics | 5.0 /100 | #234 | Tragic $38,283 |
| Sudanese | 4.4 /100 | #235 | Tragic $38,215 |
| Liberians | 4.4 /100 | #236 | Tragic $38,215 |
| Immigrants | Cabo Verde | 4.3 /100 | #237 | Tragic $38,208 |
| Alaska Natives | 4.3 /100 | #238 | Tragic $38,202 |
Demographics Similar to Barbadians by Median Female Earnings
In terms of median female earnings, the demographic groups most similar to Barbadians are Immigrants from Brazil ($41,273, a difference of 0.030%), Immigrants from England ($41,277, a difference of 0.040%), Korean ($41,276, a difference of 0.040%), Macedonian ($41,286, a difference of 0.060%), and Immigrants from North America ($41,319, a difference of 0.14%).
| Demographics | Rating | Rank | Median Female Earnings |
| Immigrants | Western Asia | 97.0 /100 | #110 | Exceptional $41,375 |
| Immigrants | Canada | 97.0 /100 | #111 | Exceptional $41,373 |
| Immigrants | North America | 96.7 /100 | #112 | Exceptional $41,319 |
| Macedonians | 96.4 /100 | #113 | Exceptional $41,286 |
| Immigrants | England | 96.4 /100 | #114 | Exceptional $41,277 |
| Koreans | 96.4 /100 | #115 | Exceptional $41,276 |
| Immigrants | Brazil | 96.4 /100 | #116 | Exceptional $41,273 |
| Barbadians | 96.3 /100 | #117 | Exceptional $41,261 |
| Immigrants | Lebanon | 95.6 /100 | #118 | Exceptional $41,183 |
| Immigrants | Philippines | 95.0 /100 | #119 | Exceptional $41,114 |
| Immigrants | Kuwait | 94.4 /100 | #120 | Exceptional $41,055 |
| Croatians | 93.7 /100 | #121 | Exceptional $40,993 |
| Immigrants | Jordan | 93.5 /100 | #122 | Exceptional $40,977 |
| Guyanese | 93.4 /100 | #123 | Exceptional $40,973 |
| Trinidadians and Tobagonians | 93.2 /100 | #124 | Exceptional $40,958 |