Belizean vs Barbadian 8th Grade
COMPARE
Belizean
Barbadian
8th Grade
8th Grade Comparison
Belizeans
Barbadians
93.1%
8TH GRADE
0.0/ 100
METRIC RATING
321st/ 347
METRIC RANK
94.6%
8TH GRADE
0.1/ 100
METRIC RATING
280th/ 347
METRIC RANK
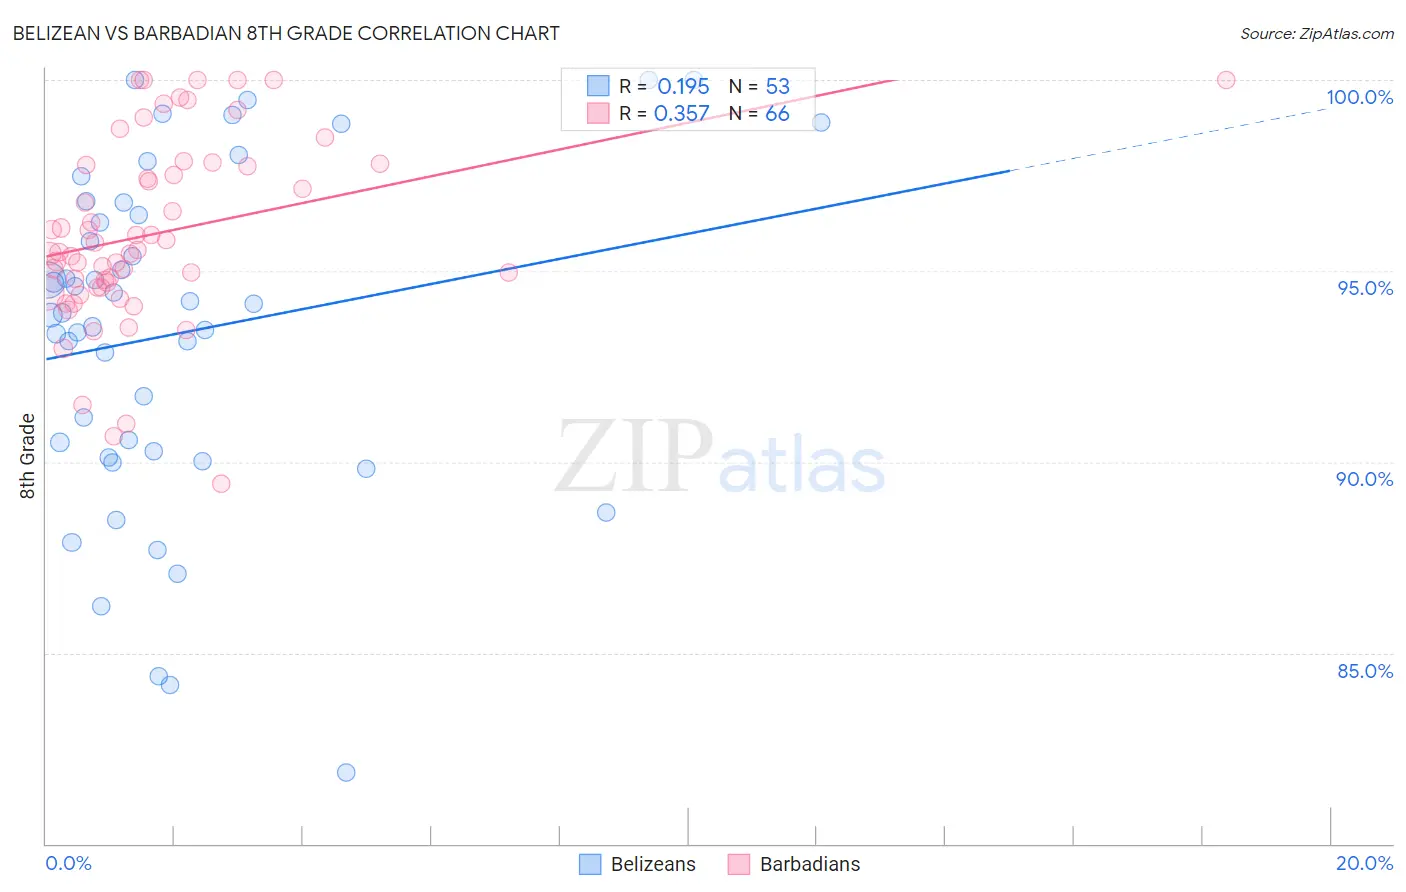
Belizean vs Barbadian 8th Grade Correlation Chart
The statistical analysis conducted on geographies consisting of 144,138,333 people shows a poor positive correlation between the proportion of Belizeans and percentage of population with at least 8th grade education in the United States with a correlation coefficient (R) of 0.195 and weighted average of 93.1%. Similarly, the statistical analysis conducted on geographies consisting of 141,299,217 people shows a mild positive correlation between the proportion of Barbadians and percentage of population with at least 8th grade education in the United States with a correlation coefficient (R) of 0.357 and weighted average of 94.6%, a difference of 1.7%.
8th Grade Correlation Summary
| Measurement | Belizean | Barbadian |
| Minimum | 81.9% | 89.4% |
| Maximum | 100.0% | 100.0% |
| Range | 18.1% | 10.6% |
| Mean | 93.4% | 96.0% |
| Median | 93.9% | 95.5% |
| Interquartile 25% (IQ1) | 90.2% | 94.6% |
| Interquartile 75% (IQ3) | 96.6% | 97.8% |
| Interquartile Range (IQR) | 6.4% | 3.2% |
| Standard Deviation (Sample) | 4.4% | 2.4% |
| Standard Deviation (Population) | 4.3% | 2.4% |
Similar Demographics by 8th Grade
Demographics Similar to Belizeans by 8th Grade
In terms of 8th grade, the demographic groups most similar to Belizeans are Nicaraguan (93.0%, a difference of 0.12%), Immigrants from Fiji (93.2%, a difference of 0.13%), Immigrants from Cuba (93.2%, a difference of 0.16%), Immigrants from Belize (92.9%, a difference of 0.17%), and Puerto Rican (93.2%, a difference of 0.19%).
| Demographics | Rating | Rank | 8th Grade |
| Immigrants | Vietnam | 0.0 /100 | #314 | Tragic 93.5% |
| Vietnamese | 0.0 /100 | #315 | Tragic 93.5% |
| Immigrants | Cambodia | 0.0 /100 | #316 | Tragic 93.3% |
| Immigrants | Ecuador | 0.0 /100 | #317 | Tragic 93.3% |
| Puerto Ricans | 0.0 /100 | #318 | Tragic 93.2% |
| Immigrants | Cuba | 0.0 /100 | #319 | Tragic 93.2% |
| Immigrants | Fiji | 0.0 /100 | #320 | Tragic 93.2% |
| Belizeans | 0.0 /100 | #321 | Tragic 93.1% |
| Nicaraguans | 0.0 /100 | #322 | Tragic 93.0% |
| Immigrants | Belize | 0.0 /100 | #323 | Tragic 92.9% |
| Nepalese | 0.0 /100 | #324 | Tragic 92.8% |
| Dominicans | 0.0 /100 | #325 | Tragic 92.8% |
| Central American Indians | 0.0 /100 | #326 | Tragic 92.7% |
| Immigrants | Azores | 0.0 /100 | #327 | Tragic 92.5% |
| Immigrants | Nicaragua | 0.0 /100 | #328 | Tragic 92.5% |
Demographics Similar to Barbadians by 8th Grade
In terms of 8th grade, the demographic groups most similar to Barbadians are Immigrants from Trinidad and Tobago (94.6%, a difference of 0.0%), Immigrants from Bolivia (94.6%, a difference of 0.0%), Armenian (94.7%, a difference of 0.010%), Taiwanese (94.7%, a difference of 0.040%), and Immigrants from Eritrea (94.6%, a difference of 0.040%).
| Demographics | Rating | Rank | 8th Grade |
| Immigrants | Western Africa | 0.2 /100 | #273 | Tragic 94.8% |
| Trinidadians and Tobagonians | 0.2 /100 | #274 | Tragic 94.7% |
| Immigrants | Colombia | 0.2 /100 | #275 | Tragic 94.7% |
| Peruvians | 0.1 /100 | #276 | Tragic 94.7% |
| Taiwanese | 0.1 /100 | #277 | Tragic 94.7% |
| Armenians | 0.1 /100 | #278 | Tragic 94.7% |
| Immigrants | Trinidad and Tobago | 0.1 /100 | #279 | Tragic 94.6% |
| Barbadians | 0.1 /100 | #280 | Tragic 94.6% |
| Immigrants | Bolivia | 0.1 /100 | #281 | Tragic 94.6% |
| Immigrants | Eritrea | 0.1 /100 | #282 | Tragic 94.6% |
| Immigrants | St. Vincent and the Grenadines | 0.1 /100 | #283 | Tragic 94.6% |
| Immigrants | Philippines | 0.1 /100 | #284 | Tragic 94.6% |
| Immigrants | Barbados | 0.0 /100 | #285 | Tragic 94.5% |
| Immigrants | Peru | 0.0 /100 | #286 | Tragic 94.5% |
| Tohono O'odham | 0.0 /100 | #287 | Tragic 94.5% |