Belgian vs Native Hawaiian Per Capita Income
COMPARE
Belgian
Native Hawaiian
Per Capita Income
Per Capita Income Comparison
Belgians
Native Hawaiians
$43,951
PER CAPITA INCOME
58.1/ 100
METRIC RATING
168th/ 347
METRIC RANK
$41,017
PER CAPITA INCOME
4.9/ 100
METRIC RATING
230th/ 347
METRIC RANK
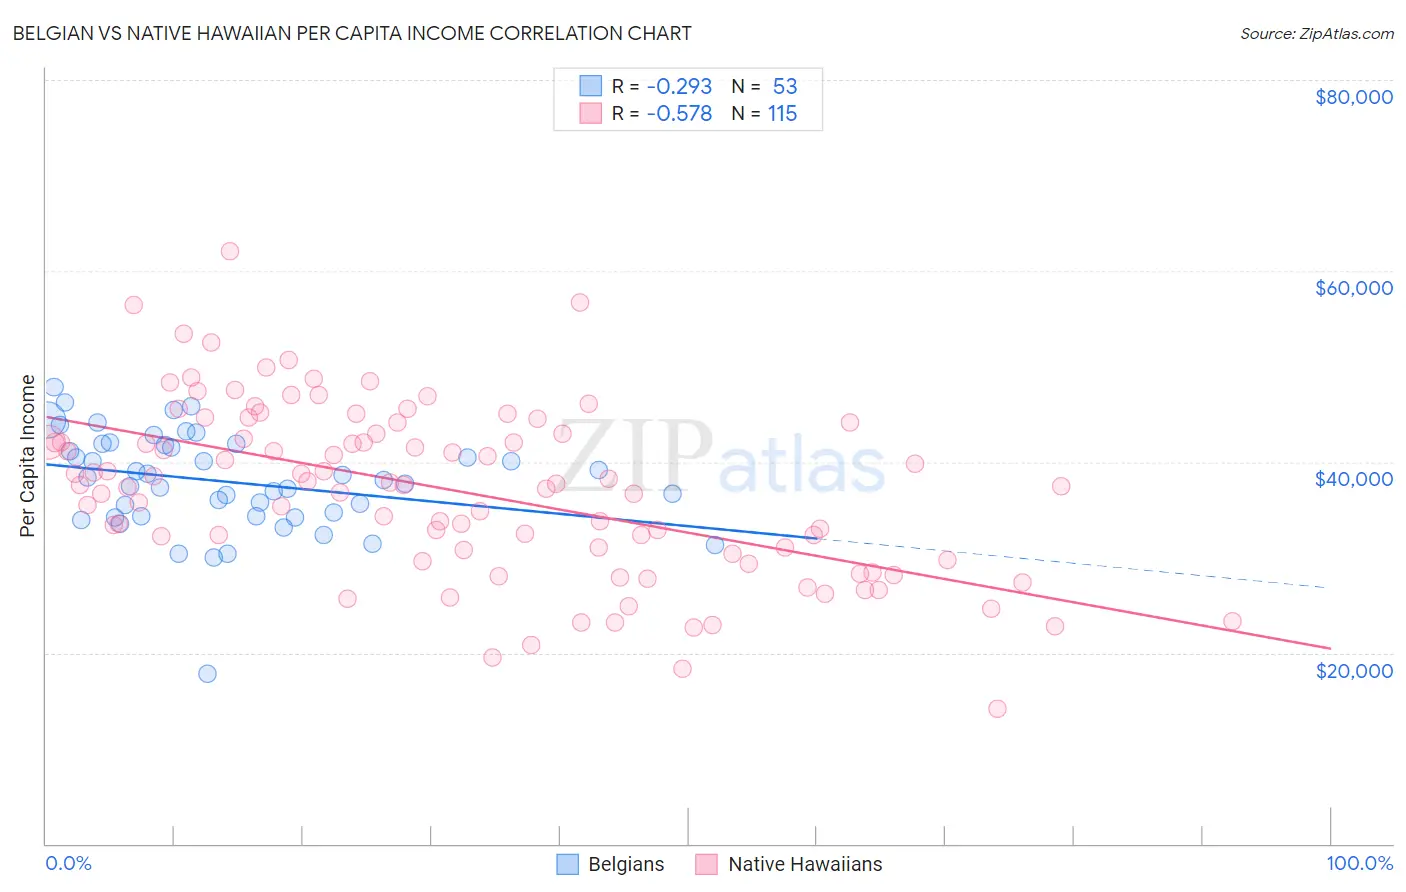
Belgian vs Native Hawaiian Per Capita Income Correlation Chart
The statistical analysis conducted on geographies consisting of 356,040,185 people shows a weak negative correlation between the proportion of Belgians and per capita income in the United States with a correlation coefficient (R) of -0.293 and weighted average of $43,951. Similarly, the statistical analysis conducted on geographies consisting of 332,135,115 people shows a substantial negative correlation between the proportion of Native Hawaiians and per capita income in the United States with a correlation coefficient (R) of -0.578 and weighted average of $41,017, a difference of 7.1%.
Per Capita Income Correlation Summary
| Measurement | Belgian | Native Hawaiian |
| Minimum | $17,858 | $14,082 |
| Maximum | $47,841 | $62,011 |
| Range | $29,983 | $47,929 |
| Mean | $37,900 | $36,984 |
| Median | $38,096 | $37,623 |
| Interquartile 25% (IQ1) | $34,290 | $30,336 |
| Interquartile 75% (IQ3) | $41,814 | $42,931 |
| Interquartile Range (IQR) | $7,525 | $12,595 |
| Standard Deviation (Sample) | $5,270 | $9,013 |
| Standard Deviation (Population) | $5,220 | $8,974 |
Similar Demographics by Per Capita Income
Demographics Similar to Belgians by Per Capita Income
In terms of per capita income, the demographic groups most similar to Belgians are English ($43,982, a difference of 0.070%), Immigrants from Uruguay ($43,997, a difference of 0.10%), Immigrants from Philippines ($44,000, a difference of 0.11%), Sri Lankan ($44,014, a difference of 0.14%), and Immigrants from Peru ($43,852, a difference of 0.23%).
| Demographics | Rating | Rank | Per Capita Income |
| Costa Ricans | 61.8 /100 | #161 | Good $44,090 |
| Swiss | 61.4 /100 | #162 | Good $44,076 |
| Immigrants | South America | 61.2 /100 | #163 | Good $44,068 |
| Sri Lankans | 59.8 /100 | #164 | Average $44,014 |
| Immigrants | Philippines | 59.4 /100 | #165 | Average $44,000 |
| Immigrants | Uruguay | 59.3 /100 | #166 | Average $43,997 |
| English | 58.9 /100 | #167 | Average $43,982 |
| Belgians | 58.1 /100 | #168 | Average $43,951 |
| Immigrants | Peru | 55.3 /100 | #169 | Average $43,852 |
| Scandinavians | 55.2 /100 | #170 | Average $43,848 |
| Immigrants | Eastern Africa | 54.9 /100 | #171 | Average $43,838 |
| Czechoslovakians | 54.1 /100 | #172 | Average $43,806 |
| French | 50.7 /100 | #173 | Average $43,685 |
| Colombians | 50.0 /100 | #174 | Average $43,661 |
| Celtics | 48.9 /100 | #175 | Average $43,621 |
Demographics Similar to Native Hawaiians by Per Capita Income
In terms of per capita income, the demographic groups most similar to Native Hawaiians are Nigerian ($41,026, a difference of 0.020%), Senegalese ($41,000, a difference of 0.040%), Guyanese ($40,949, a difference of 0.16%), Immigrants from Grenada ($41,123, a difference of 0.26%), and Immigrants from Ghana ($41,131, a difference of 0.28%).
| Demographics | Rating | Rank | Per Capita Income |
| Immigrants | Cameroon | 6.8 /100 | #223 | Tragic $41,334 |
| Immigrants | St. Vincent and the Grenadines | 6.4 /100 | #224 | Tragic $41,270 |
| West Indians | 6.0 /100 | #225 | Tragic $41,217 |
| Immigrants | Ecuador | 5.9 /100 | #226 | Tragic $41,195 |
| Immigrants | Ghana | 5.5 /100 | #227 | Tragic $41,131 |
| Immigrants | Grenada | 5.5 /100 | #228 | Tragic $41,123 |
| Nigerians | 4.9 /100 | #229 | Tragic $41,026 |
| Native Hawaiians | 4.9 /100 | #230 | Tragic $41,017 |
| Senegalese | 4.8 /100 | #231 | Tragic $41,000 |
| Guyanese | 4.5 /100 | #232 | Tragic $40,949 |
| Delaware | 3.8 /100 | #233 | Tragic $40,778 |
| Immigrants | West Indies | 3.7 /100 | #234 | Tragic $40,763 |
| Immigrants | Guyana | 3.6 /100 | #235 | Tragic $40,742 |
| Immigrants | Nonimmigrants | 3.4 /100 | #236 | Tragic $40,669 |
| Immigrants | Cambodia | 2.6 /100 | #237 | Tragic $40,434 |