Belgian vs Immigrants from Greece Per Capita Income
COMPARE
Belgian
Immigrants from Greece
Per Capita Income
Per Capita Income Comparison
Belgians
Immigrants from Greece
$43,951
PER CAPITA INCOME
58.1/ 100
METRIC RATING
168th/ 347
METRIC RANK
$51,891
PER CAPITA INCOME
100.0/ 100
METRIC RATING
36th/ 347
METRIC RANK
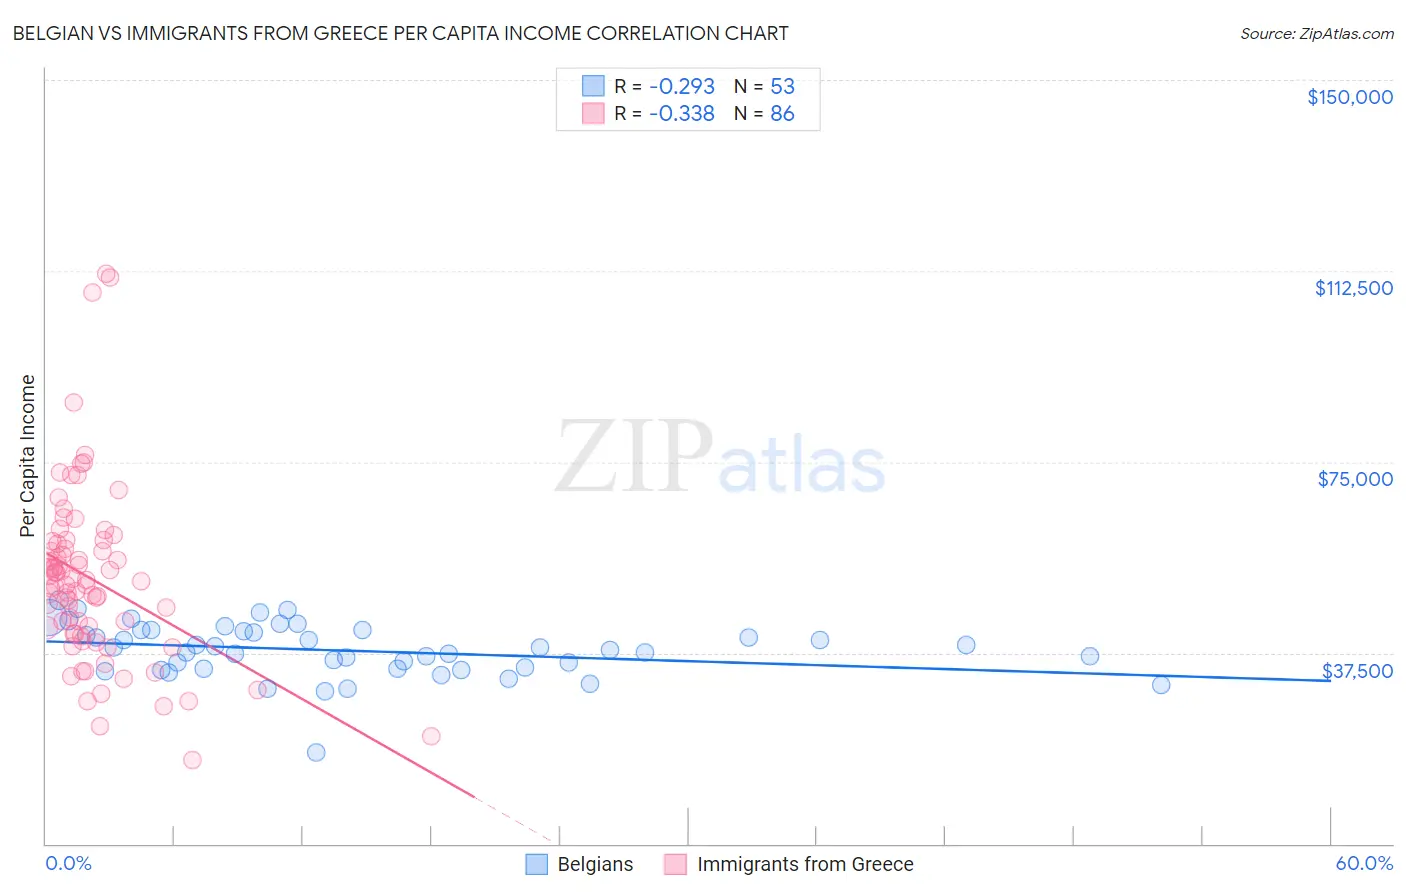
Belgian vs Immigrants from Greece Per Capita Income Correlation Chart
The statistical analysis conducted on geographies consisting of 356,040,185 people shows a weak negative correlation between the proportion of Belgians and per capita income in the United States with a correlation coefficient (R) of -0.293 and weighted average of $43,951. Similarly, the statistical analysis conducted on geographies consisting of 216,879,011 people shows a mild negative correlation between the proportion of Immigrants from Greece and per capita income in the United States with a correlation coefficient (R) of -0.338 and weighted average of $51,891, a difference of 18.1%.
Per Capita Income Correlation Summary
| Measurement | Belgian | Immigrants from Greece |
| Minimum | $17,858 | $16,481 |
| Maximum | $47,841 | $111,988 |
| Range | $29,983 | $95,507 |
| Mean | $37,900 | $52,082 |
| Median | $38,096 | $51,208 |
| Interquartile 25% (IQ1) | $34,290 | $41,348 |
| Interquartile 75% (IQ3) | $41,814 | $58,850 |
| Interquartile Range (IQR) | $7,525 | $17,502 |
| Standard Deviation (Sample) | $5,270 | $17,408 |
| Standard Deviation (Population) | $5,220 | $17,307 |
Similar Demographics by Per Capita Income
Demographics Similar to Belgians by Per Capita Income
In terms of per capita income, the demographic groups most similar to Belgians are English ($43,982, a difference of 0.070%), Immigrants from Uruguay ($43,997, a difference of 0.10%), Immigrants from Philippines ($44,000, a difference of 0.11%), Sri Lankan ($44,014, a difference of 0.14%), and Immigrants from Peru ($43,852, a difference of 0.23%).
| Demographics | Rating | Rank | Per Capita Income |
| Costa Ricans | 61.8 /100 | #161 | Good $44,090 |
| Swiss | 61.4 /100 | #162 | Good $44,076 |
| Immigrants | South America | 61.2 /100 | #163 | Good $44,068 |
| Sri Lankans | 59.8 /100 | #164 | Average $44,014 |
| Immigrants | Philippines | 59.4 /100 | #165 | Average $44,000 |
| Immigrants | Uruguay | 59.3 /100 | #166 | Average $43,997 |
| English | 58.9 /100 | #167 | Average $43,982 |
| Belgians | 58.1 /100 | #168 | Average $43,951 |
| Immigrants | Peru | 55.3 /100 | #169 | Average $43,852 |
| Scandinavians | 55.2 /100 | #170 | Average $43,848 |
| Immigrants | Eastern Africa | 54.9 /100 | #171 | Average $43,838 |
| Czechoslovakians | 54.1 /100 | #172 | Average $43,806 |
| French | 50.7 /100 | #173 | Average $43,685 |
| Colombians | 50.0 /100 | #174 | Average $43,661 |
| Celtics | 48.9 /100 | #175 | Average $43,621 |
Demographics Similar to Immigrants from Greece by Per Capita Income
In terms of per capita income, the demographic groups most similar to Immigrants from Greece are Estonian ($51,875, a difference of 0.030%), Burmese ($52,005, a difference of 0.22%), Immigrants from Czechoslovakia ($51,770, a difference of 0.23%), Immigrants from Russia ($52,044, a difference of 0.29%), and Cambodian ($51,731, a difference of 0.31%).
| Demographics | Rating | Rank | Per Capita Income |
| Israelis | 100.0 /100 | #29 | Exceptional $52,596 |
| Immigrants | Austria | 100.0 /100 | #30 | Exceptional $52,503 |
| Turks | 100.0 /100 | #31 | Exceptional $52,391 |
| Immigrants | Norway | 100.0 /100 | #32 | Exceptional $52,217 |
| Australians | 100.0 /100 | #33 | Exceptional $52,074 |
| Immigrants | Russia | 100.0 /100 | #34 | Exceptional $52,044 |
| Burmese | 100.0 /100 | #35 | Exceptional $52,005 |
| Immigrants | Greece | 100.0 /100 | #36 | Exceptional $51,891 |
| Estonians | 100.0 /100 | #37 | Exceptional $51,875 |
| Immigrants | Czechoslovakia | 100.0 /100 | #38 | Exceptional $51,770 |
| Cambodians | 100.0 /100 | #39 | Exceptional $51,731 |
| Immigrants | Korea | 100.0 /100 | #40 | Exceptional $51,671 |
| Immigrants | South Africa | 100.0 /100 | #41 | Exceptional $51,465 |
| Immigrants | Turkey | 100.0 /100 | #42 | Exceptional $51,368 |
| Immigrants | Lithuania | 100.0 /100 | #43 | Exceptional $51,361 |