Immigrants from Congo vs Native Hawaiian Per Capita Income
COMPARE
Immigrants from Congo
Native Hawaiian
Per Capita Income
Per Capita Income Comparison
Immigrants from Congo
Native Hawaiians
$35,720
PER CAPITA INCOME
0.0/ 100
METRIC RATING
319th/ 347
METRIC RANK
$41,017
PER CAPITA INCOME
4.9/ 100
METRIC RATING
230th/ 347
METRIC RANK
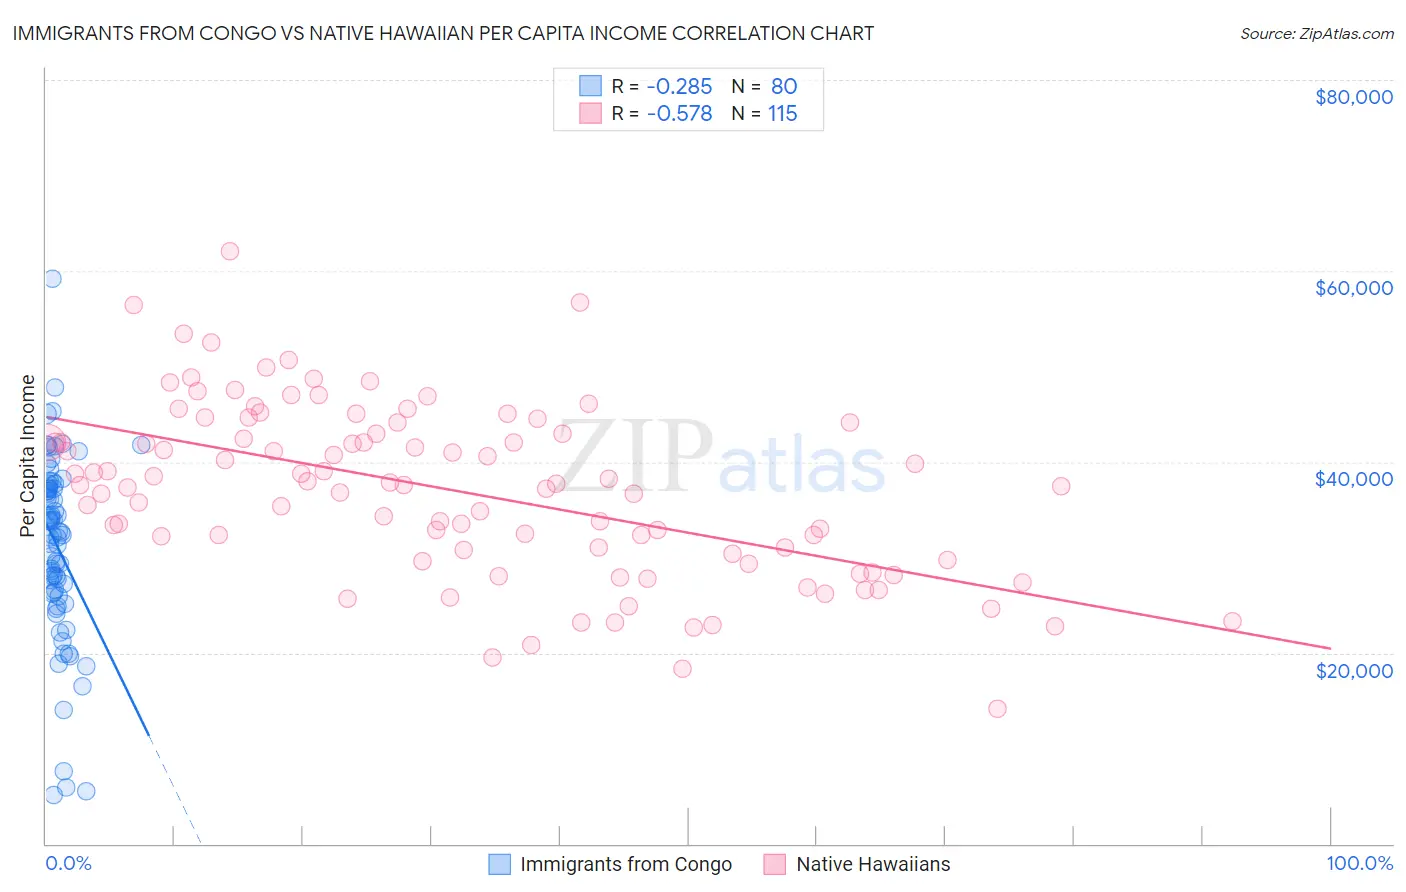
Immigrants from Congo vs Native Hawaiian Per Capita Income Correlation Chart
The statistical analysis conducted on geographies consisting of 92,126,617 people shows a weak negative correlation between the proportion of Immigrants from Congo and per capita income in the United States with a correlation coefficient (R) of -0.285 and weighted average of $35,720. Similarly, the statistical analysis conducted on geographies consisting of 332,135,115 people shows a substantial negative correlation between the proportion of Native Hawaiians and per capita income in the United States with a correlation coefficient (R) of -0.578 and weighted average of $41,017, a difference of 14.8%.
Per Capita Income Correlation Summary
| Measurement | Immigrants from Congo | Native Hawaiian |
| Minimum | $5,075 | $14,082 |
| Maximum | $59,125 | $62,011 |
| Range | $54,050 | $47,929 |
| Mean | $31,172 | $36,984 |
| Median | $32,475 | $37,623 |
| Interquartile 25% (IQ1) | $26,293 | $30,336 |
| Interquartile 75% (IQ3) | $37,243 | $42,931 |
| Interquartile Range (IQR) | $10,950 | $12,595 |
| Standard Deviation (Sample) | $9,699 | $9,013 |
| Standard Deviation (Population) | $9,639 | $8,974 |
Similar Demographics by Per Capita Income
Demographics Similar to Immigrants from Congo by Per Capita Income
In terms of per capita income, the demographic groups most similar to Immigrants from Congo are Hispanic or Latino ($35,688, a difference of 0.090%), Black/African American ($35,564, a difference of 0.44%), Creek ($35,546, a difference of 0.49%), Bangladeshi ($35,897, a difference of 0.50%), and Dutch West Indian ($35,922, a difference of 0.57%).
| Demographics | Rating | Rank | Per Capita Income |
| Chickasaw | 0.0 /100 | #312 | Tragic $36,475 |
| Bahamians | 0.0 /100 | #313 | Tragic $36,427 |
| Seminole | 0.0 /100 | #314 | Tragic $36,180 |
| Yaqui | 0.0 /100 | #315 | Tragic $36,112 |
| Choctaw | 0.0 /100 | #316 | Tragic $35,999 |
| Dutch West Indians | 0.0 /100 | #317 | Tragic $35,922 |
| Bangladeshis | 0.0 /100 | #318 | Tragic $35,897 |
| Immigrants | Congo | 0.0 /100 | #319 | Tragic $35,720 |
| Hispanics or Latinos | 0.0 /100 | #320 | Tragic $35,688 |
| Blacks/African Americans | 0.0 /100 | #321 | Tragic $35,564 |
| Creek | 0.0 /100 | #322 | Tragic $35,546 |
| Cheyenne | 0.0 /100 | #323 | Tragic $35,276 |
| Kiowa | 0.0 /100 | #324 | Tragic $35,102 |
| Immigrants | Central America | 0.0 /100 | #325 | Tragic $34,974 |
| Immigrants | Cuba | 0.0 /100 | #326 | Tragic $34,910 |
Demographics Similar to Native Hawaiians by Per Capita Income
In terms of per capita income, the demographic groups most similar to Native Hawaiians are Nigerian ($41,026, a difference of 0.020%), Senegalese ($41,000, a difference of 0.040%), Guyanese ($40,949, a difference of 0.16%), Immigrants from Grenada ($41,123, a difference of 0.26%), and Immigrants from Ghana ($41,131, a difference of 0.28%).
| Demographics | Rating | Rank | Per Capita Income |
| Immigrants | Cameroon | 6.8 /100 | #223 | Tragic $41,334 |
| Immigrants | St. Vincent and the Grenadines | 6.4 /100 | #224 | Tragic $41,270 |
| West Indians | 6.0 /100 | #225 | Tragic $41,217 |
| Immigrants | Ecuador | 5.9 /100 | #226 | Tragic $41,195 |
| Immigrants | Ghana | 5.5 /100 | #227 | Tragic $41,131 |
| Immigrants | Grenada | 5.5 /100 | #228 | Tragic $41,123 |
| Nigerians | 4.9 /100 | #229 | Tragic $41,026 |
| Native Hawaiians | 4.9 /100 | #230 | Tragic $41,017 |
| Senegalese | 4.8 /100 | #231 | Tragic $41,000 |
| Guyanese | 4.5 /100 | #232 | Tragic $40,949 |
| Delaware | 3.8 /100 | #233 | Tragic $40,778 |
| Immigrants | West Indies | 3.7 /100 | #234 | Tragic $40,763 |
| Immigrants | Guyana | 3.6 /100 | #235 | Tragic $40,742 |
| Immigrants | Nonimmigrants | 3.4 /100 | #236 | Tragic $40,669 |
| Immigrants | Cambodia | 2.6 /100 | #237 | Tragic $40,434 |