Belgian vs Cherokee Per Capita Income
COMPARE
Belgian
Cherokee
Per Capita Income
Per Capita Income Comparison
Belgians
Cherokee
$43,951
PER CAPITA INCOME
58.1/ 100
METRIC RATING
168th/ 347
METRIC RANK
$37,203
PER CAPITA INCOME
0.1/ 100
METRIC RATING
299th/ 347
METRIC RANK
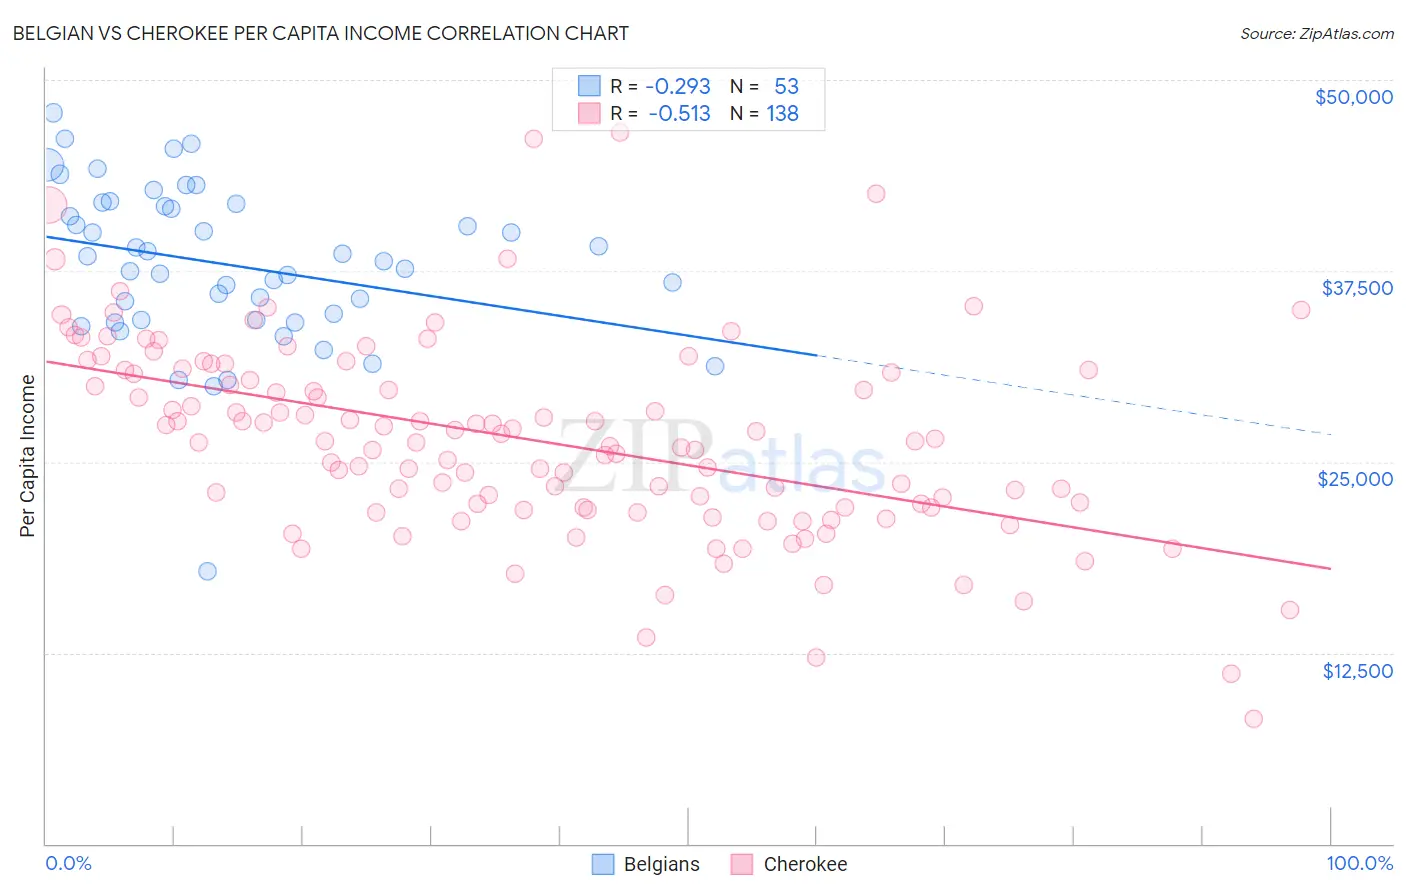
Belgian vs Cherokee Per Capita Income Correlation Chart
The statistical analysis conducted on geographies consisting of 356,040,185 people shows a weak negative correlation between the proportion of Belgians and per capita income in the United States with a correlation coefficient (R) of -0.293 and weighted average of $43,951. Similarly, the statistical analysis conducted on geographies consisting of 493,739,592 people shows a substantial negative correlation between the proportion of Cherokee and per capita income in the United States with a correlation coefficient (R) of -0.513 and weighted average of $37,203, a difference of 18.1%.
Per Capita Income Correlation Summary
| Measurement | Belgian | Cherokee |
| Minimum | $17,858 | $8,186 |
| Maximum | $47,841 | $46,594 |
| Range | $29,983 | $38,408 |
| Mean | $37,900 | $26,478 |
| Median | $38,096 | $26,343 |
| Interquartile 25% (IQ1) | $34,290 | $21,995 |
| Interquartile 75% (IQ3) | $41,814 | $30,981 |
| Interquartile Range (IQR) | $7,525 | $8,986 |
| Standard Deviation (Sample) | $5,270 | $6,463 |
| Standard Deviation (Population) | $5,220 | $6,439 |
Similar Demographics by Per Capita Income
Demographics Similar to Belgians by Per Capita Income
In terms of per capita income, the demographic groups most similar to Belgians are English ($43,982, a difference of 0.070%), Immigrants from Uruguay ($43,997, a difference of 0.10%), Immigrants from Philippines ($44,000, a difference of 0.11%), Sri Lankan ($44,014, a difference of 0.14%), and Immigrants from Peru ($43,852, a difference of 0.23%).
| Demographics | Rating | Rank | Per Capita Income |
| Costa Ricans | 61.8 /100 | #161 | Good $44,090 |
| Swiss | 61.4 /100 | #162 | Good $44,076 |
| Immigrants | South America | 61.2 /100 | #163 | Good $44,068 |
| Sri Lankans | 59.8 /100 | #164 | Average $44,014 |
| Immigrants | Philippines | 59.4 /100 | #165 | Average $44,000 |
| Immigrants | Uruguay | 59.3 /100 | #166 | Average $43,997 |
| English | 58.9 /100 | #167 | Average $43,982 |
| Belgians | 58.1 /100 | #168 | Average $43,951 |
| Immigrants | Peru | 55.3 /100 | #169 | Average $43,852 |
| Scandinavians | 55.2 /100 | #170 | Average $43,848 |
| Immigrants | Eastern Africa | 54.9 /100 | #171 | Average $43,838 |
| Czechoslovakians | 54.1 /100 | #172 | Average $43,806 |
| French | 50.7 /100 | #173 | Average $43,685 |
| Colombians | 50.0 /100 | #174 | Average $43,661 |
| Celtics | 48.9 /100 | #175 | Average $43,621 |
Demographics Similar to Cherokee by Per Capita Income
In terms of per capita income, the demographic groups most similar to Cherokee are Immigrants from Bahamas ($37,193, a difference of 0.030%), Immigrants from Caribbean ($37,254, a difference of 0.14%), Haitian ($37,289, a difference of 0.23%), Indonesian ($37,300, a difference of 0.26%), and Immigrants from Dominican Republic ($37,306, a difference of 0.27%).
| Demographics | Rating | Rank | Per Capita Income |
| Immigrants | Micronesia | 0.1 /100 | #292 | Tragic $37,464 |
| Mexican American Indians | 0.1 /100 | #293 | Tragic $37,407 |
| Cubans | 0.1 /100 | #294 | Tragic $37,383 |
| Immigrants | Dominican Republic | 0.1 /100 | #295 | Tragic $37,306 |
| Indonesians | 0.1 /100 | #296 | Tragic $37,300 |
| Haitians | 0.1 /100 | #297 | Tragic $37,289 |
| Immigrants | Caribbean | 0.1 /100 | #298 | Tragic $37,254 |
| Cherokee | 0.1 /100 | #299 | Tragic $37,203 |
| Immigrants | Bahamas | 0.1 /100 | #300 | Tragic $37,193 |
| Ottawa | 0.1 /100 | #301 | Tragic $37,101 |
| Shoshone | 0.1 /100 | #302 | Tragic $37,072 |
| Paiute | 0.1 /100 | #303 | Tragic $37,066 |
| Hondurans | 0.1 /100 | #304 | Tragic $37,031 |
| Inupiat | 0.1 /100 | #305 | Tragic $36,999 |
| Immigrants | Haiti | 0.0 /100 | #306 | Tragic $36,849 |