Belgian vs Pennsylvania German Per Capita Income
COMPARE
Belgian
Pennsylvania German
Per Capita Income
Per Capita Income Comparison
Belgians
Pennsylvania Germans
$43,951
PER CAPITA INCOME
58.1/ 100
METRIC RATING
168th/ 347
METRIC RANK
$37,842
PER CAPITA INCOME
0.1/ 100
METRIC RATING
283rd/ 347
METRIC RANK
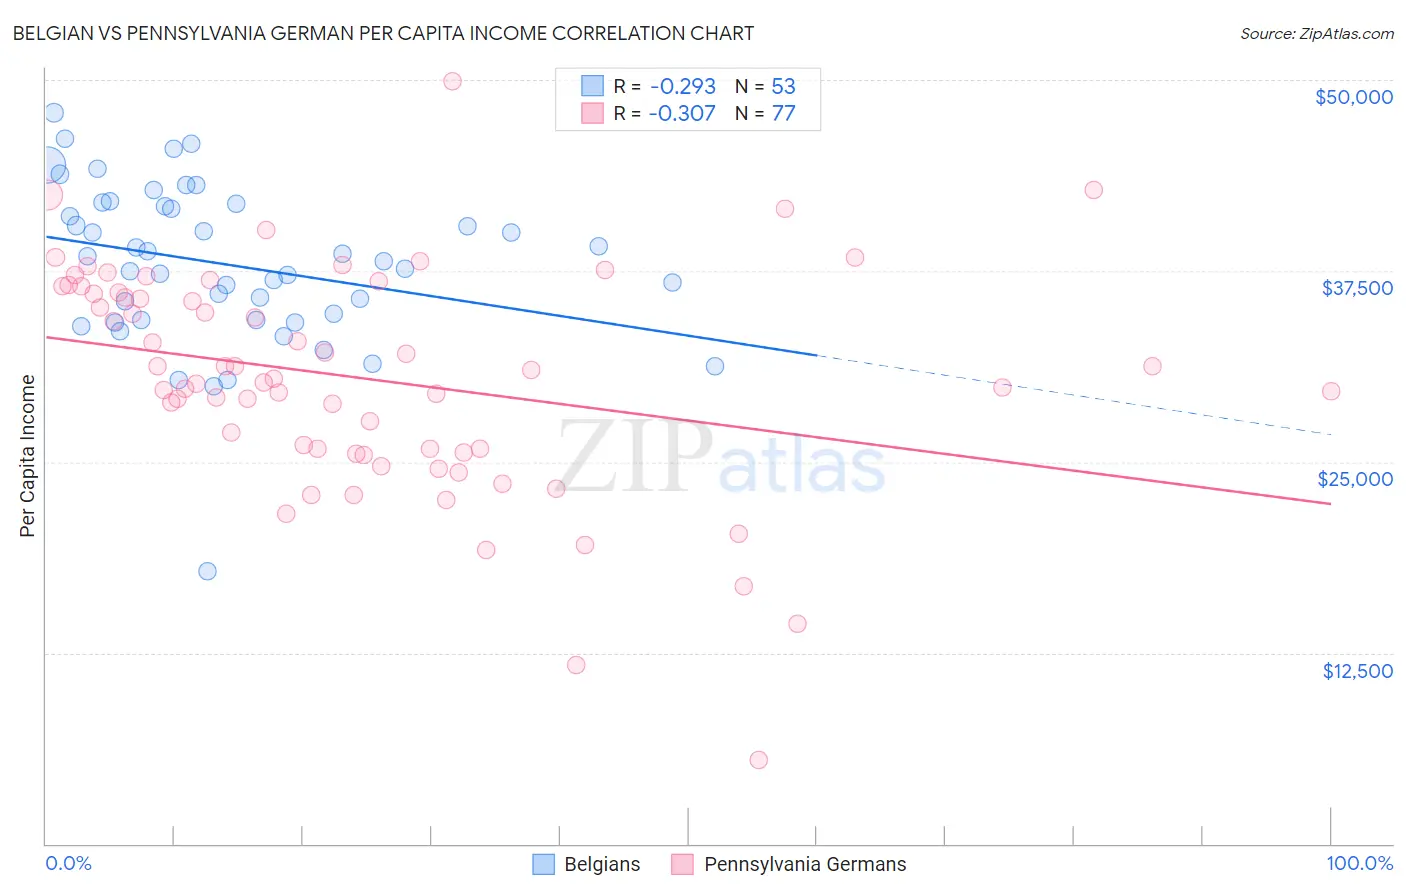
Belgian vs Pennsylvania German Per Capita Income Correlation Chart
The statistical analysis conducted on geographies consisting of 356,040,185 people shows a weak negative correlation between the proportion of Belgians and per capita income in the United States with a correlation coefficient (R) of -0.293 and weighted average of $43,951. Similarly, the statistical analysis conducted on geographies consisting of 234,109,606 people shows a mild negative correlation between the proportion of Pennsylvania Germans and per capita income in the United States with a correlation coefficient (R) of -0.307 and weighted average of $37,842, a difference of 16.2%.
Per Capita Income Correlation Summary
| Measurement | Belgian | Pennsylvania German |
| Minimum | $17,858 | $5,500 |
| Maximum | $47,841 | $49,889 |
| Range | $29,983 | $44,389 |
| Mean | $37,900 | $30,450 |
| Median | $38,096 | $30,408 |
| Interquartile 25% (IQ1) | $34,290 | $25,731 |
| Interquartile 75% (IQ3) | $41,814 | $36,297 |
| Interquartile Range (IQR) | $7,525 | $10,566 |
| Standard Deviation (Sample) | $5,270 | $7,465 |
| Standard Deviation (Population) | $5,220 | $7,416 |
Similar Demographics by Per Capita Income
Demographics Similar to Belgians by Per Capita Income
In terms of per capita income, the demographic groups most similar to Belgians are English ($43,982, a difference of 0.070%), Immigrants from Uruguay ($43,997, a difference of 0.10%), Immigrants from Philippines ($44,000, a difference of 0.11%), Sri Lankan ($44,014, a difference of 0.14%), and Immigrants from Peru ($43,852, a difference of 0.23%).
| Demographics | Rating | Rank | Per Capita Income |
| Costa Ricans | 61.8 /100 | #161 | Good $44,090 |
| Swiss | 61.4 /100 | #162 | Good $44,076 |
| Immigrants | South America | 61.2 /100 | #163 | Good $44,068 |
| Sri Lankans | 59.8 /100 | #164 | Average $44,014 |
| Immigrants | Philippines | 59.4 /100 | #165 | Average $44,000 |
| Immigrants | Uruguay | 59.3 /100 | #166 | Average $43,997 |
| English | 58.9 /100 | #167 | Average $43,982 |
| Belgians | 58.1 /100 | #168 | Average $43,951 |
| Immigrants | Peru | 55.3 /100 | #169 | Average $43,852 |
| Scandinavians | 55.2 /100 | #170 | Average $43,848 |
| Immigrants | Eastern Africa | 54.9 /100 | #171 | Average $43,838 |
| Czechoslovakians | 54.1 /100 | #172 | Average $43,806 |
| French | 50.7 /100 | #173 | Average $43,685 |
| Colombians | 50.0 /100 | #174 | Average $43,661 |
| Celtics | 48.9 /100 | #175 | Average $43,621 |
Demographics Similar to Pennsylvania Germans by Per Capita Income
In terms of per capita income, the demographic groups most similar to Pennsylvania Germans are Immigrants from Laos ($37,857, a difference of 0.040%), African ($37,785, a difference of 0.15%), Guatemalan ($37,766, a difference of 0.20%), Immigrants from Dominica ($37,952, a difference of 0.29%), and Central American Indian ($37,699, a difference of 0.38%).
| Demographics | Rating | Rank | Per Capita Income |
| Hmong | 0.2 /100 | #276 | Tragic $38,120 |
| Comanche | 0.2 /100 | #277 | Tragic $38,088 |
| Immigrants | Nicaragua | 0.2 /100 | #278 | Tragic $38,065 |
| Colville | 0.2 /100 | #279 | Tragic $38,047 |
| Potawatomi | 0.2 /100 | #280 | Tragic $38,046 |
| Immigrants | Dominica | 0.2 /100 | #281 | Tragic $37,952 |
| Immigrants | Laos | 0.1 /100 | #282 | Tragic $37,857 |
| Pennsylvania Germans | 0.1 /100 | #283 | Tragic $37,842 |
| Africans | 0.1 /100 | #284 | Tragic $37,785 |
| Guatemalans | 0.1 /100 | #285 | Tragic $37,766 |
| Central American Indians | 0.1 /100 | #286 | Tragic $37,699 |
| Dominicans | 0.1 /100 | #287 | Tragic $37,697 |
| Blackfeet | 0.1 /100 | #288 | Tragic $37,695 |
| U.S. Virgin Islanders | 0.1 /100 | #289 | Tragic $37,589 |
| Immigrants | Guatemala | 0.1 /100 | #290 | Tragic $37,550 |