Immigrants from Poland vs Native Hawaiian Per Capita Income
COMPARE
Immigrants from Poland
Native Hawaiian
Per Capita Income
Per Capita Income Comparison
Immigrants from Poland
Native Hawaiians
$45,979
PER CAPITA INCOME
93.1/ 100
METRIC RATING
119th/ 347
METRIC RANK
$41,017
PER CAPITA INCOME
4.9/ 100
METRIC RATING
230th/ 347
METRIC RANK
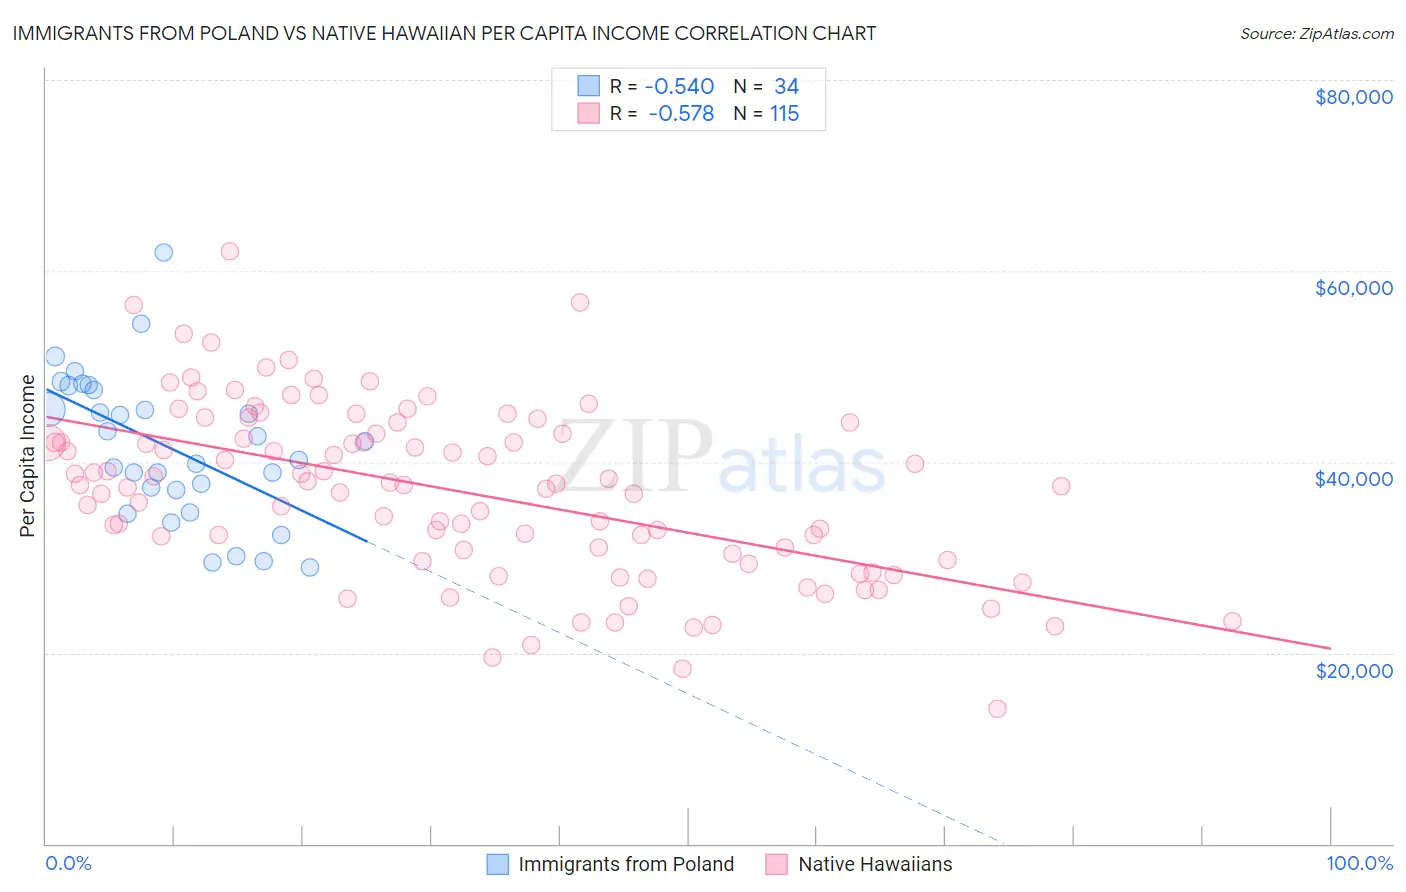
Immigrants from Poland vs Native Hawaiian Per Capita Income Correlation Chart
The statistical analysis conducted on geographies consisting of 304,861,873 people shows a substantial negative correlation between the proportion of Immigrants from Poland and per capita income in the United States with a correlation coefficient (R) of -0.540 and weighted average of $45,979. Similarly, the statistical analysis conducted on geographies consisting of 332,135,115 people shows a substantial negative correlation between the proportion of Native Hawaiians and per capita income in the United States with a correlation coefficient (R) of -0.578 and weighted average of $41,017, a difference of 12.1%.
Per Capita Income Correlation Summary
| Measurement | Immigrants from Poland | Native Hawaiian |
| Minimum | $28,915 | $14,082 |
| Maximum | $61,894 | $62,011 |
| Range | $32,979 | $47,929 |
| Mean | $41,553 | $36,984 |
| Median | $41,224 | $37,623 |
| Interquartile 25% (IQ1) | $37,111 | $30,336 |
| Interquartile 75% (IQ3) | $47,562 | $42,931 |
| Interquartile Range (IQR) | $10,451 | $12,595 |
| Standard Deviation (Sample) | $7,628 | $9,013 |
| Standard Deviation (Population) | $7,515 | $8,974 |
Similar Demographics by Per Capita Income
Demographics Similar to Immigrants from Poland by Per Capita Income
In terms of per capita income, the demographic groups most similar to Immigrants from Poland are Immigrants from Saudi Arabia ($46,008, a difference of 0.060%), Immigrants from Ethiopia ($45,923, a difference of 0.12%), Chinese ($46,098, a difference of 0.26%), Canadian ($45,858, a difference of 0.27%), and Moroccan ($45,854, a difference of 0.27%).
| Demographics | Rating | Rank | Per Capita Income |
| Immigrants | Morocco | 95.7 /100 | #112 | Exceptional $46,430 |
| Immigrants | Albania | 95.5 /100 | #113 | Exceptional $46,387 |
| Afghans | 94.9 /100 | #114 | Exceptional $46,268 |
| Immigrants | Chile | 94.6 /100 | #115 | Exceptional $46,213 |
| Poles | 94.1 /100 | #116 | Exceptional $46,123 |
| Chinese | 93.9 /100 | #117 | Exceptional $46,098 |
| Immigrants | Saudi Arabia | 93.3 /100 | #118 | Exceptional $46,008 |
| Immigrants | Poland | 93.1 /100 | #119 | Exceptional $45,979 |
| Immigrants | Ethiopia | 92.7 /100 | #120 | Exceptional $45,923 |
| Canadians | 92.2 /100 | #121 | Exceptional $45,858 |
| Moroccans | 92.1 /100 | #122 | Exceptional $45,854 |
| Lebanese | 92.0 /100 | #123 | Exceptional $45,840 |
| Europeans | 92.0 /100 | #124 | Exceptional $45,836 |
| Zimbabweans | 91.7 /100 | #125 | Exceptional $45,804 |
| Palestinians | 91.6 /100 | #126 | Exceptional $45,790 |
Demographics Similar to Native Hawaiians by Per Capita Income
In terms of per capita income, the demographic groups most similar to Native Hawaiians are Nigerian ($41,026, a difference of 0.020%), Senegalese ($41,000, a difference of 0.040%), Guyanese ($40,949, a difference of 0.16%), Immigrants from Grenada ($41,123, a difference of 0.26%), and Immigrants from Ghana ($41,131, a difference of 0.28%).
| Demographics | Rating | Rank | Per Capita Income |
| Immigrants | Cameroon | 6.8 /100 | #223 | Tragic $41,334 |
| Immigrants | St. Vincent and the Grenadines | 6.4 /100 | #224 | Tragic $41,270 |
| West Indians | 6.0 /100 | #225 | Tragic $41,217 |
| Immigrants | Ecuador | 5.9 /100 | #226 | Tragic $41,195 |
| Immigrants | Ghana | 5.5 /100 | #227 | Tragic $41,131 |
| Immigrants | Grenada | 5.5 /100 | #228 | Tragic $41,123 |
| Nigerians | 4.9 /100 | #229 | Tragic $41,026 |
| Native Hawaiians | 4.9 /100 | #230 | Tragic $41,017 |
| Senegalese | 4.8 /100 | #231 | Tragic $41,000 |
| Guyanese | 4.5 /100 | #232 | Tragic $40,949 |
| Delaware | 3.8 /100 | #233 | Tragic $40,778 |
| Immigrants | West Indies | 3.7 /100 | #234 | Tragic $40,763 |
| Immigrants | Guyana | 3.6 /100 | #235 | Tragic $40,742 |
| Immigrants | Nonimmigrants | 3.4 /100 | #236 | Tragic $40,669 |
| Immigrants | Cambodia | 2.6 /100 | #237 | Tragic $40,434 |