Belgian vs Alaskan Athabascan Per Capita Income
COMPARE
Belgian
Alaskan Athabascan
Per Capita Income
Per Capita Income Comparison
Belgians
Alaskan Athabascans
$43,951
PER CAPITA INCOME
58.1/ 100
METRIC RATING
168th/ 347
METRIC RANK
$39,163
PER CAPITA INCOME
0.6/ 100
METRIC RATING
260th/ 347
METRIC RANK
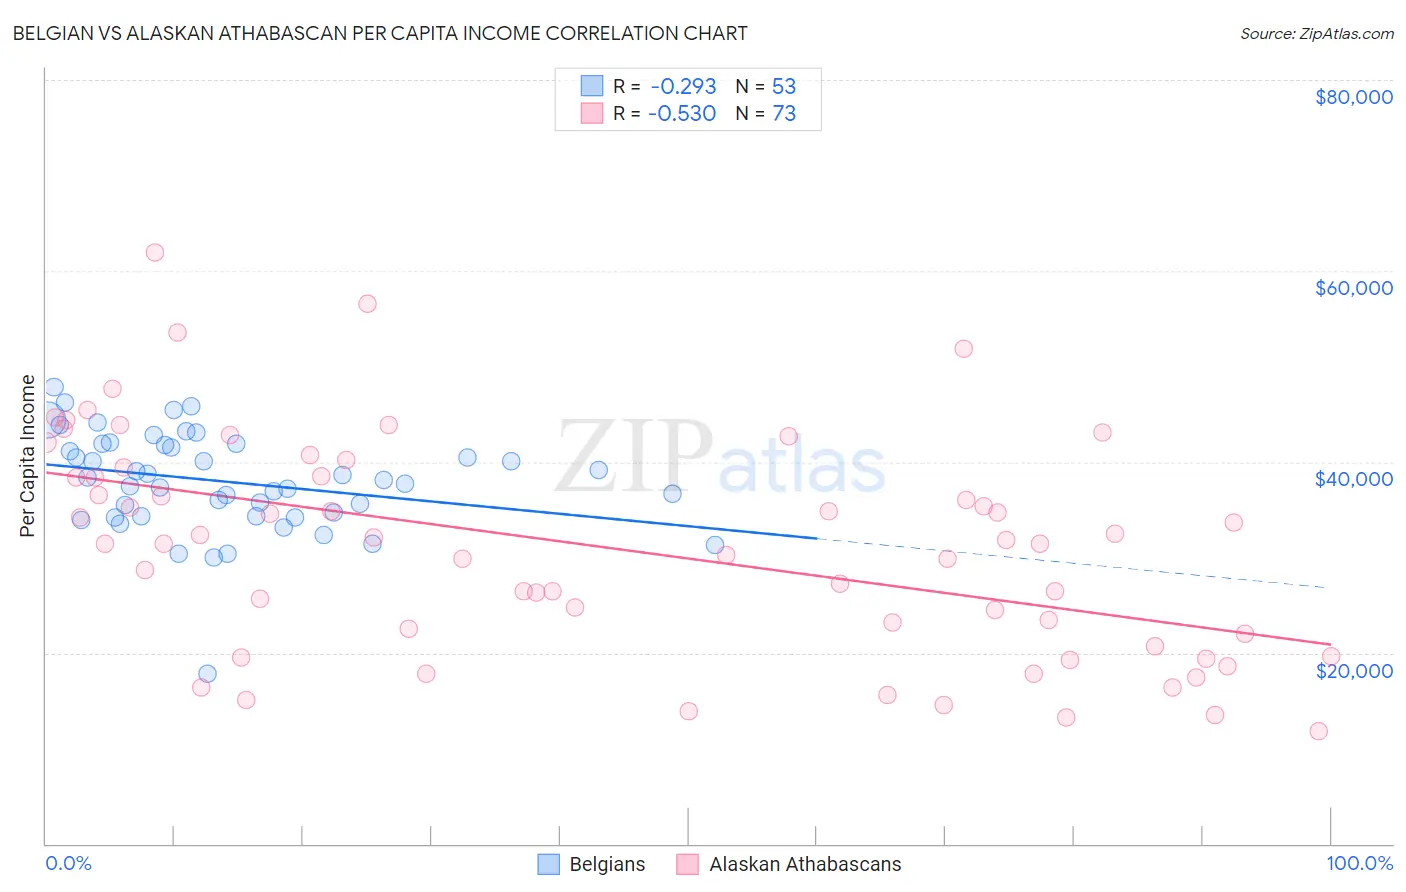
Belgian vs Alaskan Athabascan Per Capita Income Correlation Chart
The statistical analysis conducted on geographies consisting of 356,040,185 people shows a weak negative correlation between the proportion of Belgians and per capita income in the United States with a correlation coefficient (R) of -0.293 and weighted average of $43,951. Similarly, the statistical analysis conducted on geographies consisting of 45,821,401 people shows a substantial negative correlation between the proportion of Alaskan Athabascans and per capita income in the United States with a correlation coefficient (R) of -0.530 and weighted average of $39,163, a difference of 12.2%.
Per Capita Income Correlation Summary
| Measurement | Belgian | Alaskan Athabascan |
| Minimum | $17,858 | $11,811 |
| Maximum | $47,841 | $61,991 |
| Range | $29,983 | $50,180 |
| Mean | $37,900 | $31,098 |
| Median | $38,096 | $31,460 |
| Interquartile 25% (IQ1) | $34,290 | $21,337 |
| Interquartile 75% (IQ3) | $41,814 | $38,931 |
| Interquartile Range (IQR) | $7,525 | $17,594 |
| Standard Deviation (Sample) | $5,270 | $11,398 |
| Standard Deviation (Population) | $5,220 | $11,320 |
Similar Demographics by Per Capita Income
Demographics Similar to Belgians by Per Capita Income
In terms of per capita income, the demographic groups most similar to Belgians are English ($43,982, a difference of 0.070%), Immigrants from Uruguay ($43,997, a difference of 0.10%), Immigrants from Philippines ($44,000, a difference of 0.11%), Sri Lankan ($44,014, a difference of 0.14%), and Immigrants from Peru ($43,852, a difference of 0.23%).
| Demographics | Rating | Rank | Per Capita Income |
| Costa Ricans | 61.8 /100 | #161 | Good $44,090 |
| Swiss | 61.4 /100 | #162 | Good $44,076 |
| Immigrants | South America | 61.2 /100 | #163 | Good $44,068 |
| Sri Lankans | 59.8 /100 | #164 | Average $44,014 |
| Immigrants | Philippines | 59.4 /100 | #165 | Average $44,000 |
| Immigrants | Uruguay | 59.3 /100 | #166 | Average $43,997 |
| English | 58.9 /100 | #167 | Average $43,982 |
| Belgians | 58.1 /100 | #168 | Average $43,951 |
| Immigrants | Peru | 55.3 /100 | #169 | Average $43,852 |
| Scandinavians | 55.2 /100 | #170 | Average $43,848 |
| Immigrants | Eastern Africa | 54.9 /100 | #171 | Average $43,838 |
| Czechoslovakians | 54.1 /100 | #172 | Average $43,806 |
| French | 50.7 /100 | #173 | Average $43,685 |
| Colombians | 50.0 /100 | #174 | Average $43,661 |
| Celtics | 48.9 /100 | #175 | Average $43,621 |
Demographics Similar to Alaskan Athabascans by Per Capita Income
In terms of per capita income, the demographic groups most similar to Alaskan Athabascans are Malaysian ($39,194, a difference of 0.080%), Marshallese ($39,108, a difference of 0.14%), Iroquois ($39,104, a difference of 0.15%), Jamaican ($39,231, a difference of 0.17%), and Belizean ($39,097, a difference of 0.17%).
| Demographics | Rating | Rank | Per Capita Income |
| Osage | 1.0 /100 | #253 | Tragic $39,568 |
| Alaska Natives | 1.0 /100 | #254 | Tragic $39,558 |
| Immigrants | Middle Africa | 1.0 /100 | #255 | Tragic $39,529 |
| Hawaiians | 0.8 /100 | #256 | Tragic $39,403 |
| Nicaraguans | 0.8 /100 | #257 | Tragic $39,372 |
| Jamaicans | 0.7 /100 | #258 | Tragic $39,231 |
| Malaysians | 0.7 /100 | #259 | Tragic $39,194 |
| Alaskan Athabascans | 0.6 /100 | #260 | Tragic $39,163 |
| Marshallese | 0.6 /100 | #261 | Tragic $39,108 |
| Iroquois | 0.6 /100 | #262 | Tragic $39,104 |
| Belizeans | 0.6 /100 | #263 | Tragic $39,097 |
| Americans | 0.6 /100 | #264 | Tragic $39,039 |
| Spanish Americans | 0.5 /100 | #265 | Tragic $39,012 |
| Salvadorans | 0.5 /100 | #266 | Tragic $38,858 |
| Immigrants | Zaire | 0.4 /100 | #267 | Tragic $38,848 |