Belgian vs Immigrants from Romania Per Capita Income
COMPARE
Belgian
Immigrants from Romania
Per Capita Income
Per Capita Income Comparison
Belgians
Immigrants from Romania
$43,951
PER CAPITA INCOME
58.1/ 100
METRIC RATING
168th/ 347
METRIC RANK
$49,463
PER CAPITA INCOME
99.9/ 100
METRIC RATING
67th/ 347
METRIC RANK
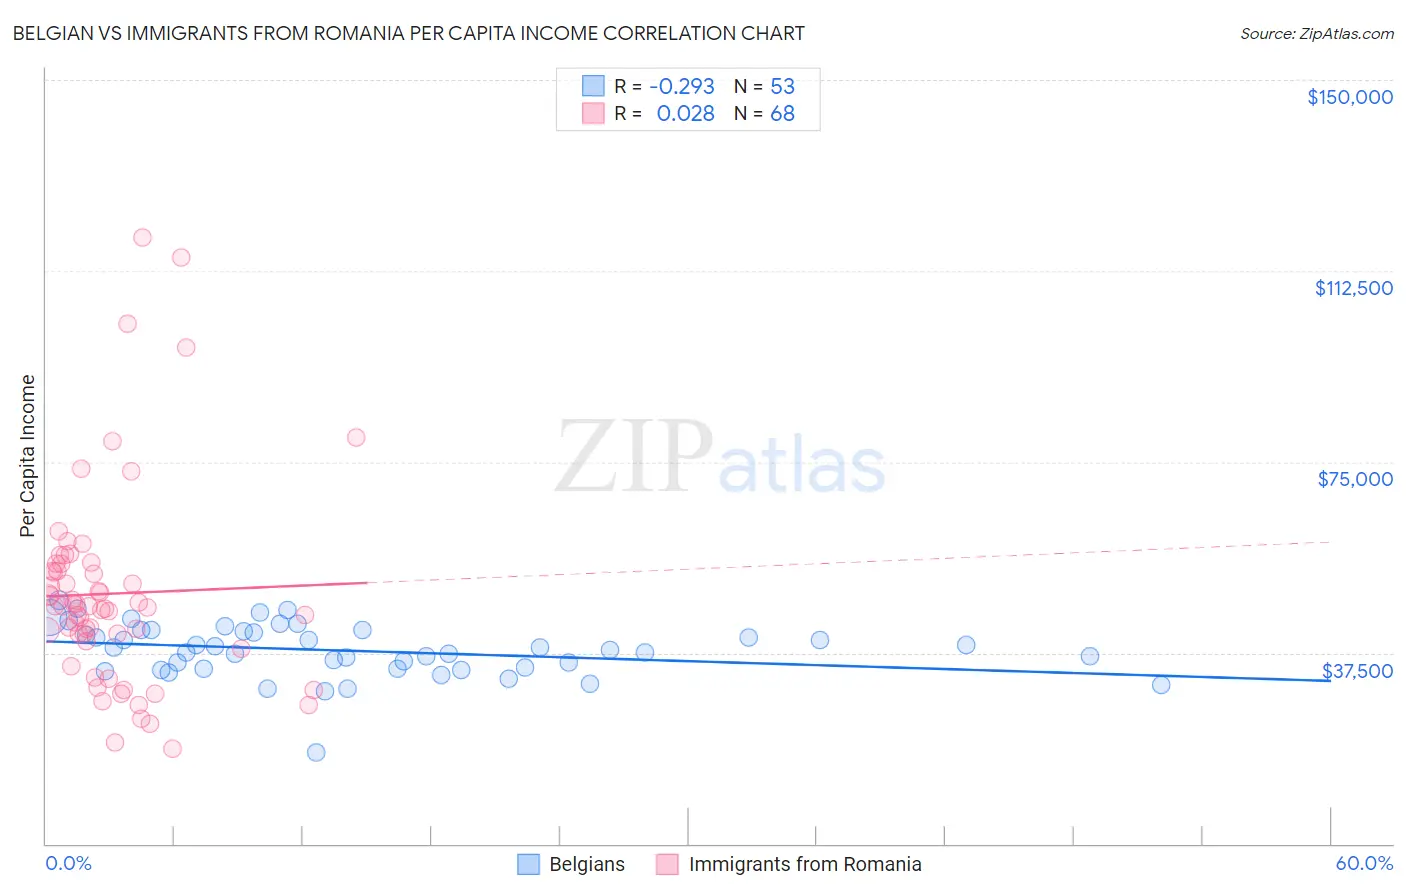
Belgian vs Immigrants from Romania Per Capita Income Correlation Chart
The statistical analysis conducted on geographies consisting of 356,040,185 people shows a weak negative correlation between the proportion of Belgians and per capita income in the United States with a correlation coefficient (R) of -0.293 and weighted average of $43,951. Similarly, the statistical analysis conducted on geographies consisting of 256,972,544 people shows no correlation between the proportion of Immigrants from Romania and per capita income in the United States with a correlation coefficient (R) of 0.028 and weighted average of $49,463, a difference of 12.5%.
Per Capita Income Correlation Summary
| Measurement | Belgian | Immigrants from Romania |
| Minimum | $17,858 | $18,731 |
| Maximum | $47,841 | $119,092 |
| Range | $29,983 | $100,361 |
| Mean | $37,900 | $49,122 |
| Median | $38,096 | $46,712 |
| Interquartile 25% (IQ1) | $34,290 | $40,435 |
| Interquartile 75% (IQ3) | $41,814 | $54,228 |
| Interquartile Range (IQR) | $7,525 | $13,794 |
| Standard Deviation (Sample) | $5,270 | $19,681 |
| Standard Deviation (Population) | $5,220 | $19,535 |
Similar Demographics by Per Capita Income
Demographics Similar to Belgians by Per Capita Income
In terms of per capita income, the demographic groups most similar to Belgians are English ($43,982, a difference of 0.070%), Immigrants from Uruguay ($43,997, a difference of 0.10%), Immigrants from Philippines ($44,000, a difference of 0.11%), Sri Lankan ($44,014, a difference of 0.14%), and Immigrants from Peru ($43,852, a difference of 0.23%).
| Demographics | Rating | Rank | Per Capita Income |
| Costa Ricans | 61.8 /100 | #161 | Good $44,090 |
| Swiss | 61.4 /100 | #162 | Good $44,076 |
| Immigrants | South America | 61.2 /100 | #163 | Good $44,068 |
| Sri Lankans | 59.8 /100 | #164 | Average $44,014 |
| Immigrants | Philippines | 59.4 /100 | #165 | Average $44,000 |
| Immigrants | Uruguay | 59.3 /100 | #166 | Average $43,997 |
| English | 58.9 /100 | #167 | Average $43,982 |
| Belgians | 58.1 /100 | #168 | Average $43,951 |
| Immigrants | Peru | 55.3 /100 | #169 | Average $43,852 |
| Scandinavians | 55.2 /100 | #170 | Average $43,848 |
| Immigrants | Eastern Africa | 54.9 /100 | #171 | Average $43,838 |
| Czechoslovakians | 54.1 /100 | #172 | Average $43,806 |
| French | 50.7 /100 | #173 | Average $43,685 |
| Colombians | 50.0 /100 | #174 | Average $43,661 |
| Celtics | 48.9 /100 | #175 | Average $43,621 |
Demographics Similar to Immigrants from Romania by Per Capita Income
In terms of per capita income, the demographic groups most similar to Immigrants from Romania are Lithuanian ($49,448, a difference of 0.030%), Immigrants from Bulgaria ($49,482, a difference of 0.040%), Immigrants from Canada ($49,412, a difference of 0.10%), Bolivian ($49,526, a difference of 0.13%), and Immigrants from Eastern Europe ($49,316, a difference of 0.30%).
| Demographics | Rating | Rank | Per Capita Income |
| Immigrants | Scotland | 99.9 /100 | #60 | Exceptional $49,893 |
| Argentineans | 99.9 /100 | #61 | Exceptional $49,862 |
| Immigrants | Asia | 99.9 /100 | #62 | Exceptional $49,741 |
| Maltese | 99.9 /100 | #63 | Exceptional $49,640 |
| Immigrants | Argentina | 99.9 /100 | #64 | Exceptional $49,627 |
| Bolivians | 99.9 /100 | #65 | Exceptional $49,526 |
| Immigrants | Bulgaria | 99.9 /100 | #66 | Exceptional $49,482 |
| Immigrants | Romania | 99.9 /100 | #67 | Exceptional $49,463 |
| Lithuanians | 99.8 /100 | #68 | Exceptional $49,448 |
| Immigrants | Canada | 99.8 /100 | #69 | Exceptional $49,412 |
| Immigrants | Eastern Europe | 99.8 /100 | #70 | Exceptional $49,316 |
| Greeks | 99.8 /100 | #71 | Exceptional $49,309 |
| Immigrants | Hungary | 99.8 /100 | #72 | Exceptional $49,303 |
| Immigrants | North America | 99.8 /100 | #73 | Exceptional $49,302 |
| Mongolians | 99.8 /100 | #74 | Exceptional $49,173 |