Belgian vs Native Hawaiian Doctorate Degree
COMPARE
Belgian
Native Hawaiian
Doctorate Degree
Doctorate Degree Comparison
Belgians
Native Hawaiians
1.8%
DOCTORATE DEGREE
50.3/ 100
METRIC RATING
172nd/ 347
METRIC RANK
1.6%
DOCTORATE DEGREE
2.1/ 100
METRIC RATING
243rd/ 347
METRIC RANK
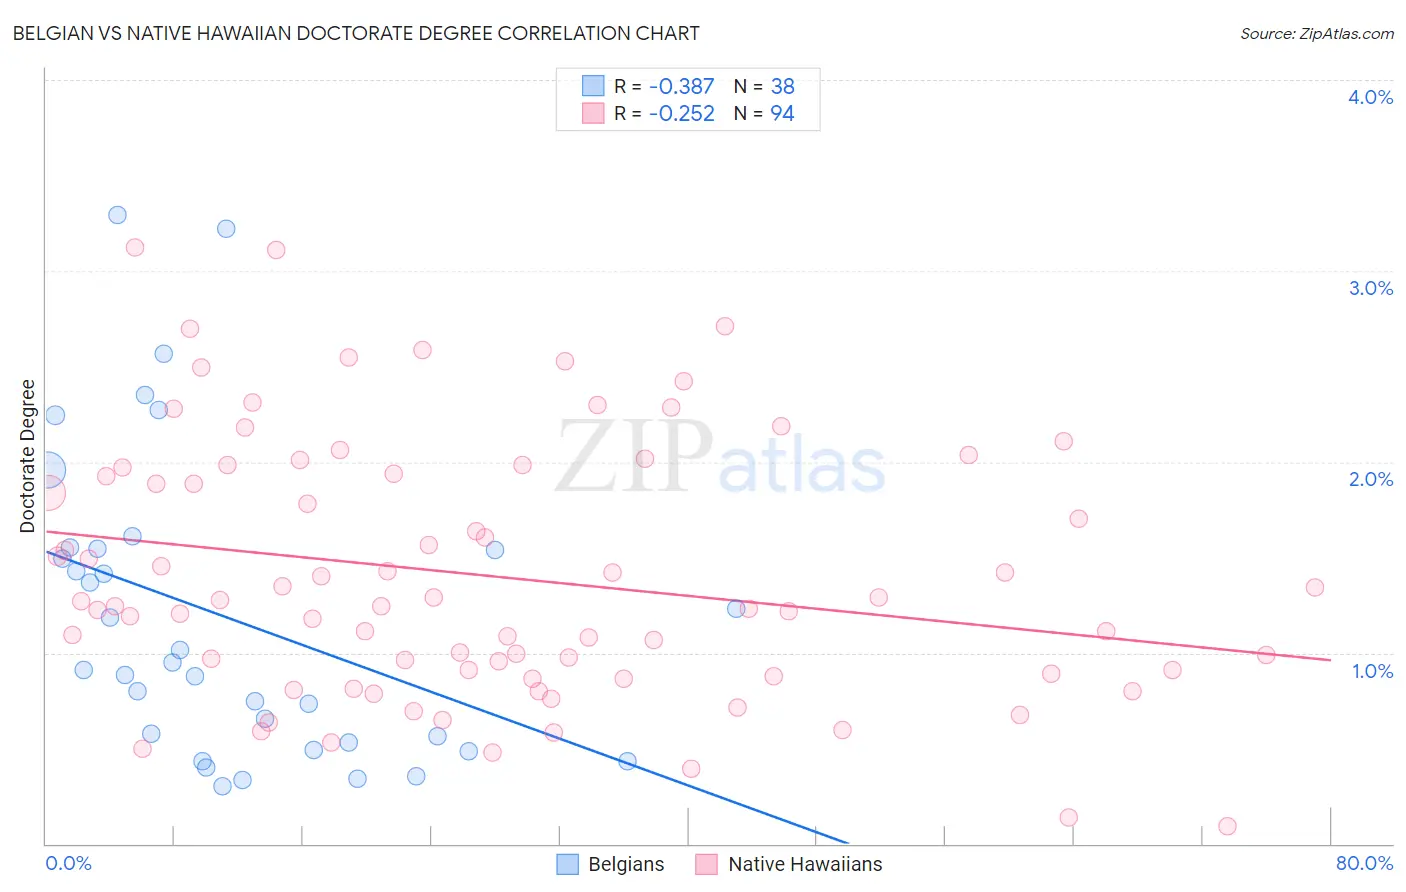
Belgian vs Native Hawaiian Doctorate Degree Correlation Chart
The statistical analysis conducted on geographies consisting of 351,946,706 people shows a mild negative correlation between the proportion of Belgians and percentage of population with at least doctorate degree education in the United States with a correlation coefficient (R) of -0.387 and weighted average of 1.8%. Similarly, the statistical analysis conducted on geographies consisting of 328,309,931 people shows a weak negative correlation between the proportion of Native Hawaiians and percentage of population with at least doctorate degree education in the United States with a correlation coefficient (R) of -0.252 and weighted average of 1.6%, a difference of 16.4%.
Doctorate Degree Correlation Summary
| Measurement | Belgian | Native Hawaiian |
| Minimum | 0.30% | 0.092% |
| Maximum | 3.3% | 3.1% |
| Range | 3.0% | 3.0% |
| Mean | 1.2% | 1.4% |
| Median | 0.93% | 1.3% |
| Interquartile 25% (IQ1) | 0.53% | 0.89% |
| Interquartile 75% (IQ3) | 1.5% | 1.9% |
| Interquartile Range (IQR) | 1.0% | 1.1% |
| Standard Deviation (Sample) | 0.80% | 0.67% |
| Standard Deviation (Population) | 0.79% | 0.67% |
Similar Demographics by Doctorate Degree
Demographics Similar to Belgians by Doctorate Degree
In terms of doctorate degree, the demographic groups most similar to Belgians are Norwegian (1.8%, a difference of 0.040%), Immigrants from Bangladesh (1.8%, a difference of 0.040%), Immigrants from Thailand (1.8%, a difference of 0.12%), Spanish (1.8%, a difference of 0.14%), and Iraqi (1.8%, a difference of 0.15%).
| Demographics | Rating | Rank | Doctorate Degree |
| Scotch-Irish | 63.6 /100 | #165 | Good 1.9% |
| Spaniards | 63.5 /100 | #166 | Good 1.9% |
| Macedonians | 60.9 /100 | #167 | Good 1.9% |
| Sri Lankans | 60.3 /100 | #168 | Good 1.9% |
| Vietnamese | 54.8 /100 | #169 | Average 1.9% |
| Costa Ricans | 53.3 /100 | #170 | Average 1.8% |
| Bermudans | 52.1 /100 | #171 | Average 1.8% |
| Belgians | 50.3 /100 | #172 | Average 1.8% |
| Norwegians | 50.0 /100 | #173 | Average 1.8% |
| Immigrants | Bangladesh | 50.0 /100 | #174 | Average 1.8% |
| Immigrants | Thailand | 49.4 /100 | #175 | Average 1.8% |
| Spanish | 49.3 /100 | #176 | Average 1.8% |
| Iraqis | 49.2 /100 | #177 | Average 1.8% |
| French | 48.8 /100 | #178 | Average 1.8% |
| Ghanaians | 48.3 /100 | #179 | Average 1.8% |
Demographics Similar to Native Hawaiians by Doctorate Degree
In terms of doctorate degree, the demographic groups most similar to Native Hawaiians are Ottawa (1.6%, a difference of 0.13%), French American Indian (1.6%, a difference of 0.19%), Cheyenne (1.6%, a difference of 0.34%), Immigrants from Panama (1.6%, a difference of 0.53%), and Delaware (1.6%, a difference of 0.57%).
| Demographics | Rating | Rank | Doctorate Degree |
| Indonesians | 2.8 /100 | #236 | Tragic 1.6% |
| Iroquois | 2.7 /100 | #237 | Tragic 1.6% |
| Immigrants | Congo | 2.6 /100 | #238 | Tragic 1.6% |
| West Indians | 2.5 /100 | #239 | Tragic 1.6% |
| Immigrants | Panama | 2.4 /100 | #240 | Tragic 1.6% |
| Cheyenne | 2.3 /100 | #241 | Tragic 1.6% |
| Ottawa | 2.2 /100 | #242 | Tragic 1.6% |
| Native Hawaiians | 2.1 /100 | #243 | Tragic 1.6% |
| French American Indians | 2.0 /100 | #244 | Tragic 1.6% |
| Delaware | 1.9 /100 | #245 | Tragic 1.6% |
| Hmong | 1.8 /100 | #246 | Tragic 1.6% |
| Comanche | 1.8 /100 | #247 | Tragic 1.6% |
| Africans | 1.8 /100 | #248 | Tragic 1.6% |
| Potawatomi | 1.6 /100 | #249 | Tragic 1.6% |
| Immigrants | Fiji | 1.6 /100 | #250 | Tragic 1.6% |