Belgian vs Immigrants from Brazil Per Capita Income
COMPARE
Belgian
Immigrants from Brazil
Per Capita Income
Per Capita Income Comparison
Belgians
Immigrants from Brazil
$43,951
PER CAPITA INCOME
58.1/ 100
METRIC RATING
168th/ 347
METRIC RANK
$48,164
PER CAPITA INCOME
99.4/ 100
METRIC RATING
83rd/ 347
METRIC RANK
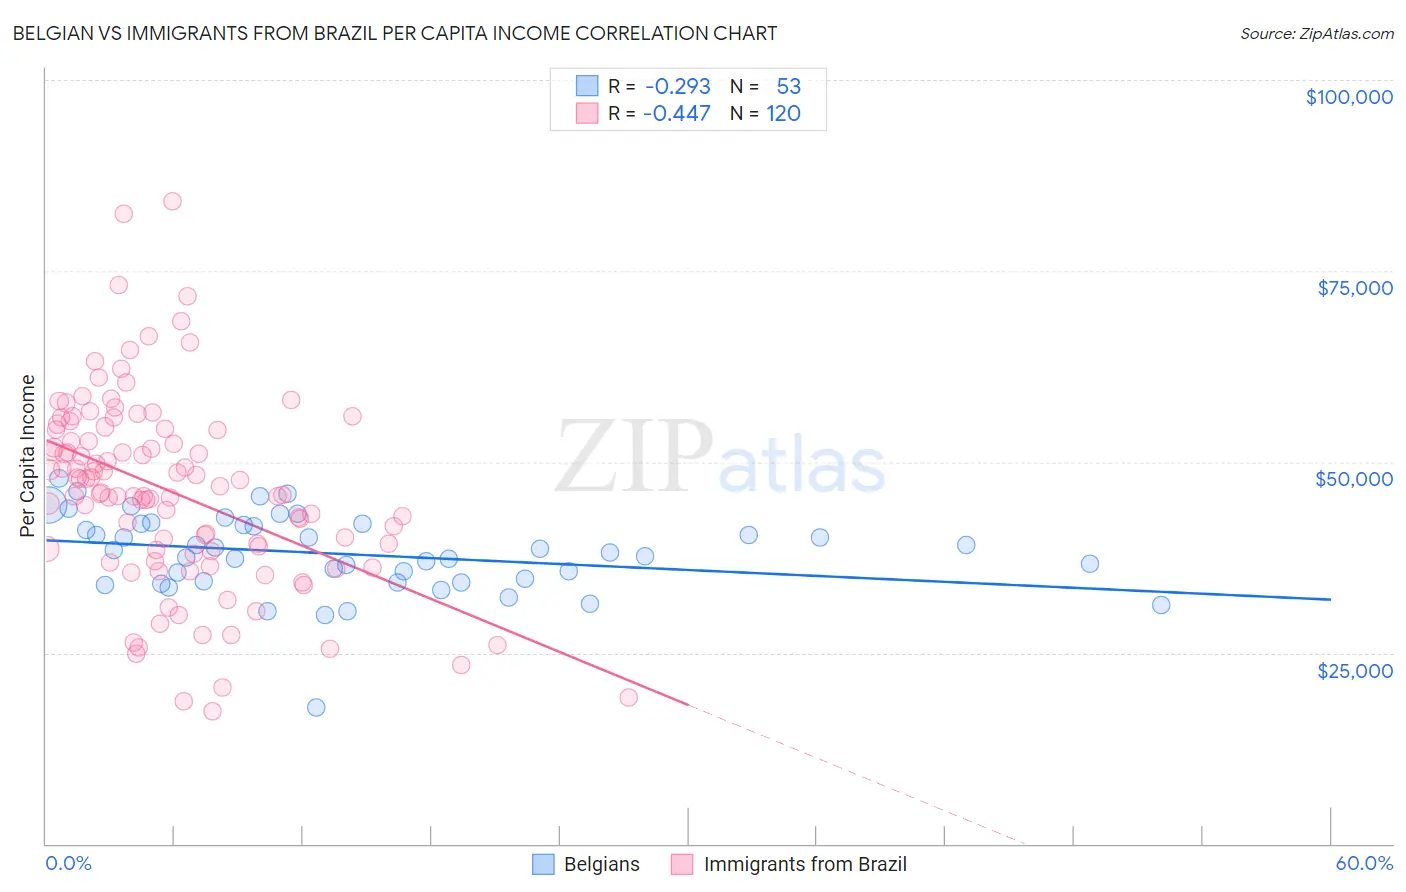
Belgian vs Immigrants from Brazil Per Capita Income Correlation Chart
The statistical analysis conducted on geographies consisting of 356,040,185 people shows a weak negative correlation between the proportion of Belgians and per capita income in the United States with a correlation coefficient (R) of -0.293 and weighted average of $43,951. Similarly, the statistical analysis conducted on geographies consisting of 343,026,133 people shows a moderate negative correlation between the proportion of Immigrants from Brazil and per capita income in the United States with a correlation coefficient (R) of -0.447 and weighted average of $48,164, a difference of 9.6%.
Per Capita Income Correlation Summary
| Measurement | Belgian | Immigrants from Brazil |
| Minimum | $17,858 | $17,376 |
| Maximum | $47,841 | $84,094 |
| Range | $29,983 | $66,718 |
| Mean | $37,900 | $46,035 |
| Median | $38,096 | $45,902 |
| Interquartile 25% (IQ1) | $34,290 | $38,349 |
| Interquartile 75% (IQ3) | $41,814 | $54,171 |
| Interquartile Range (IQR) | $7,525 | $15,822 |
| Standard Deviation (Sample) | $5,270 | $12,485 |
| Standard Deviation (Population) | $5,220 | $12,433 |
Similar Demographics by Per Capita Income
Demographics Similar to Belgians by Per Capita Income
In terms of per capita income, the demographic groups most similar to Belgians are English ($43,982, a difference of 0.070%), Immigrants from Uruguay ($43,997, a difference of 0.10%), Immigrants from Philippines ($44,000, a difference of 0.11%), Sri Lankan ($44,014, a difference of 0.14%), and Immigrants from Peru ($43,852, a difference of 0.23%).
| Demographics | Rating | Rank | Per Capita Income |
| Costa Ricans | 61.8 /100 | #161 | Good $44,090 |
| Swiss | 61.4 /100 | #162 | Good $44,076 |
| Immigrants | South America | 61.2 /100 | #163 | Good $44,068 |
| Sri Lankans | 59.8 /100 | #164 | Average $44,014 |
| Immigrants | Philippines | 59.4 /100 | #165 | Average $44,000 |
| Immigrants | Uruguay | 59.3 /100 | #166 | Average $43,997 |
| English | 58.9 /100 | #167 | Average $43,982 |
| Belgians | 58.1 /100 | #168 | Average $43,951 |
| Immigrants | Peru | 55.3 /100 | #169 | Average $43,852 |
| Scandinavians | 55.2 /100 | #170 | Average $43,848 |
| Immigrants | Eastern Africa | 54.9 /100 | #171 | Average $43,838 |
| Czechoslovakians | 54.1 /100 | #172 | Average $43,806 |
| French | 50.7 /100 | #173 | Average $43,685 |
| Colombians | 50.0 /100 | #174 | Average $43,661 |
| Celtics | 48.9 /100 | #175 | Average $43,621 |
Demographics Similar to Immigrants from Brazil by Per Capita Income
In terms of per capita income, the demographic groups most similar to Immigrants from Brazil are Immigrants from Indonesia ($48,195, a difference of 0.060%), Immigrants from Ukraine ($48,134, a difference of 0.060%), Austrian ($48,116, a difference of 0.10%), Armenian ($48,287, a difference of 0.26%), and Immigrants from Southern Europe ($48,027, a difference of 0.29%).
| Demographics | Rating | Rank | Per Capita Income |
| Immigrants | England | 99.7 /100 | #76 | Exceptional $48,844 |
| Immigrants | Kazakhstan | 99.7 /100 | #77 | Exceptional $48,747 |
| Immigrants | Italy | 99.6 /100 | #78 | Exceptional $48,654 |
| Romanians | 99.5 /100 | #79 | Exceptional $48,445 |
| Egyptians | 99.5 /100 | #80 | Exceptional $48,358 |
| Armenians | 99.4 /100 | #81 | Exceptional $48,287 |
| Immigrants | Indonesia | 99.4 /100 | #82 | Exceptional $48,195 |
| Immigrants | Brazil | 99.4 /100 | #83 | Exceptional $48,164 |
| Immigrants | Ukraine | 99.3 /100 | #84 | Exceptional $48,134 |
| Austrians | 99.3 /100 | #85 | Exceptional $48,116 |
| Immigrants | Southern Europe | 99.3 /100 | #86 | Exceptional $48,027 |
| Ukrainians | 99.3 /100 | #87 | Exceptional $48,014 |
| Croatians | 99.0 /100 | #88 | Exceptional $47,742 |
| Northern Europeans | 98.9 /100 | #89 | Exceptional $47,698 |
| Italians | 98.8 /100 | #90 | Exceptional $47,574 |