Belgian vs Immigrants from Greece Poverty
COMPARE
Belgian
Immigrants from Greece
Poverty
Poverty Comparison
Belgians
Immigrants from Greece
11.4%
POVERTY
95.8/ 100
METRIC RATING
88th/ 347
METRIC RANK
10.8%
POVERTY
99.3/ 100
METRIC RATING
37th/ 347
METRIC RANK
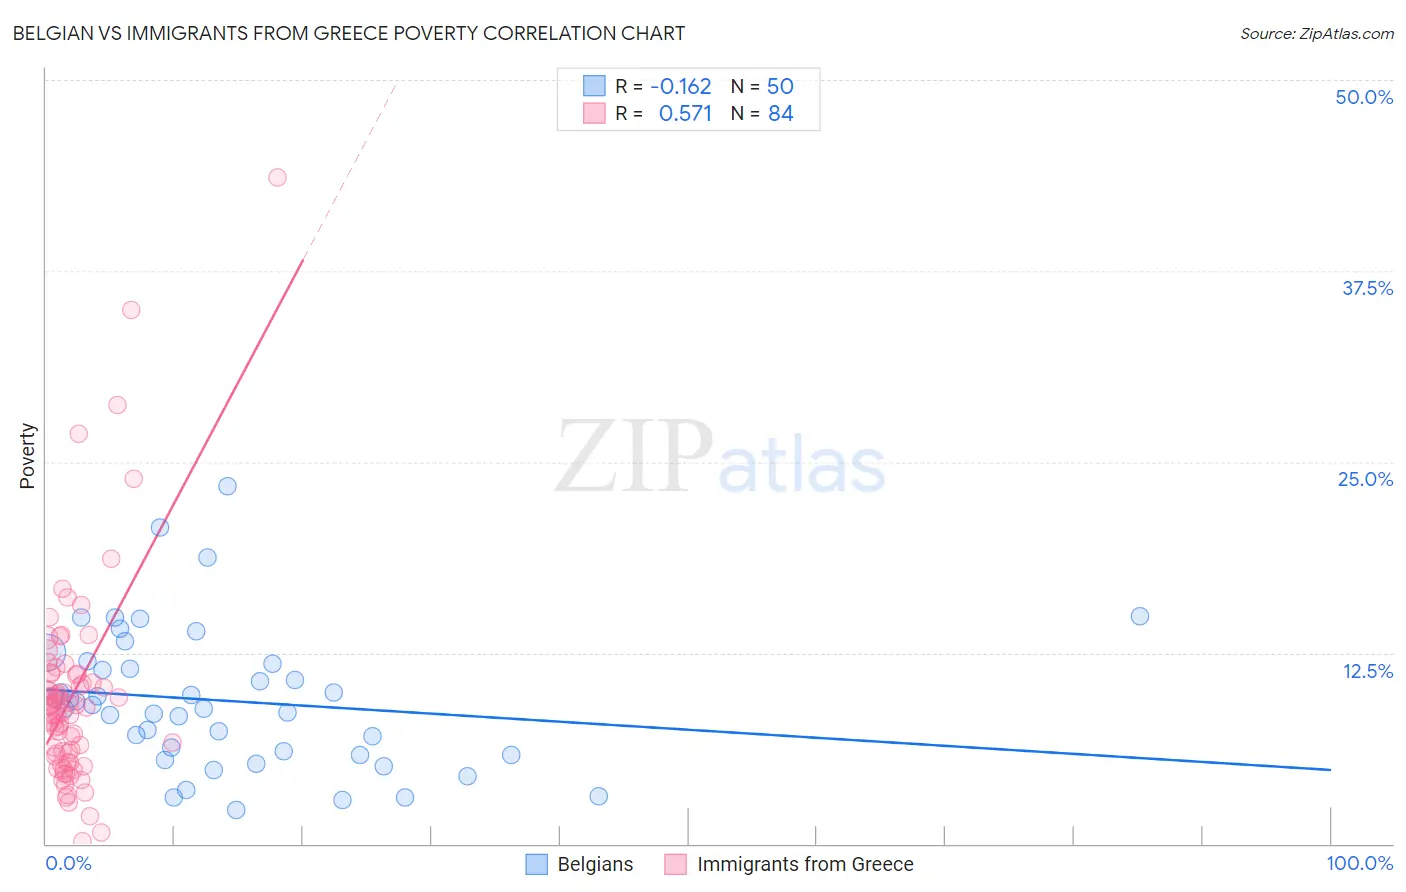
Belgian vs Immigrants from Greece Poverty Correlation Chart
The statistical analysis conducted on geographies consisting of 355,864,059 people shows a poor negative correlation between the proportion of Belgians and poverty level in the United States with a correlation coefficient (R) of -0.162 and weighted average of 11.4%. Similarly, the statistical analysis conducted on geographies consisting of 216,856,400 people shows a substantial positive correlation between the proportion of Immigrants from Greece and poverty level in the United States with a correlation coefficient (R) of 0.571 and weighted average of 10.8%, a difference of 5.1%.
Poverty Correlation Summary
| Measurement | Belgian | Immigrants from Greece |
| Minimum | 2.2% | 0.19% |
| Maximum | 23.4% | 43.6% |
| Range | 21.2% | 43.4% |
| Mean | 9.4% | 9.7% |
| Median | 9.0% | 8.9% |
| Interquartile 25% (IQ1) | 5.8% | 5.8% |
| Interquartile 75% (IQ3) | 11.8% | 11.1% |
| Interquartile Range (IQR) | 5.9% | 5.3% |
| Standard Deviation (Sample) | 4.6% | 6.8% |
| Standard Deviation (Population) | 4.5% | 6.8% |
Similar Demographics by Poverty
Demographics Similar to Belgians by Poverty
In terms of poverty, the demographic groups most similar to Belgians are Czechoslovakian (11.4%, a difference of 0.040%), Jordanian (11.4%, a difference of 0.14%), Northern European (11.4%, a difference of 0.14%), Immigrants from Denmark (11.4%, a difference of 0.20%), and Immigrants from England (11.4%, a difference of 0.26%).
| Demographics | Rating | Rank | Poverty |
| Irish | 96.6 /100 | #81 | Exceptional 11.3% |
| Egyptians | 96.5 /100 | #82 | Exceptional 11.3% |
| Immigrants | Sweden | 96.3 /100 | #83 | Exceptional 11.3% |
| English | 96.3 /100 | #84 | Exceptional 11.3% |
| Immigrants | England | 96.2 /100 | #85 | Exceptional 11.4% |
| Jordanians | 96.0 /100 | #86 | Exceptional 11.4% |
| Northern Europeans | 96.0 /100 | #87 | Exceptional 11.4% |
| Belgians | 95.8 /100 | #88 | Exceptional 11.4% |
| Czechoslovakians | 95.7 /100 | #89 | Exceptional 11.4% |
| Immigrants | Denmark | 95.5 /100 | #90 | Exceptional 11.4% |
| Finns | 95.2 /100 | #91 | Exceptional 11.4% |
| British | 95.0 /100 | #92 | Exceptional 11.4% |
| Romanians | 94.9 /100 | #93 | Exceptional 11.4% |
| Paraguayans | 94.9 /100 | #94 | Exceptional 11.4% |
| Australians | 94.9 /100 | #95 | Exceptional 11.4% |
Demographics Similar to Immigrants from Greece by Poverty
In terms of poverty, the demographic groups most similar to Immigrants from Greece are Czech (10.8%, a difference of 0.050%), Cypriot (10.8%, a difference of 0.10%), Immigrants from Pakistan (10.8%, a difference of 0.13%), Tongan (10.8%, a difference of 0.17%), and Russian (10.9%, a difference of 0.18%).
| Demographics | Rating | Rank | Poverty |
| Danes | 99.5 /100 | #30 | Exceptional 10.7% |
| Poles | 99.5 /100 | #31 | Exceptional 10.7% |
| Iranians | 99.5 /100 | #32 | Exceptional 10.7% |
| Macedonians | 99.4 /100 | #33 | Exceptional 10.8% |
| Immigrants | Poland | 99.4 /100 | #34 | Exceptional 10.8% |
| Tongans | 99.4 /100 | #35 | Exceptional 10.8% |
| Cypriots | 99.3 /100 | #36 | Exceptional 10.8% |
| Immigrants | Greece | 99.3 /100 | #37 | Exceptional 10.8% |
| Czechs | 99.3 /100 | #38 | Exceptional 10.8% |
| Immigrants | Pakistan | 99.3 /100 | #39 | Exceptional 10.8% |
| Russians | 99.3 /100 | #40 | Exceptional 10.9% |
| Immigrants | Iran | 99.2 /100 | #41 | Exceptional 10.9% |
| Koreans | 99.2 /100 | #42 | Exceptional 10.9% |
| Immigrants | Singapore | 99.2 /100 | #43 | Exceptional 10.9% |
| Immigrants | Moldova | 99.1 /100 | #44 | Exceptional 10.9% |