Belgian vs Immigrants from Greece Family Poverty
COMPARE
Belgian
Immigrants from Greece
Family Poverty
Family Poverty Comparison
Belgians
Immigrants from Greece
8.0%
FAMILY POVERTY
97.3/ 100
METRIC RATING
87th/ 347
METRIC RANK
7.7%
FAMILY POVERTY
98.7/ 100
METRIC RATING
60th/ 347
METRIC RANK
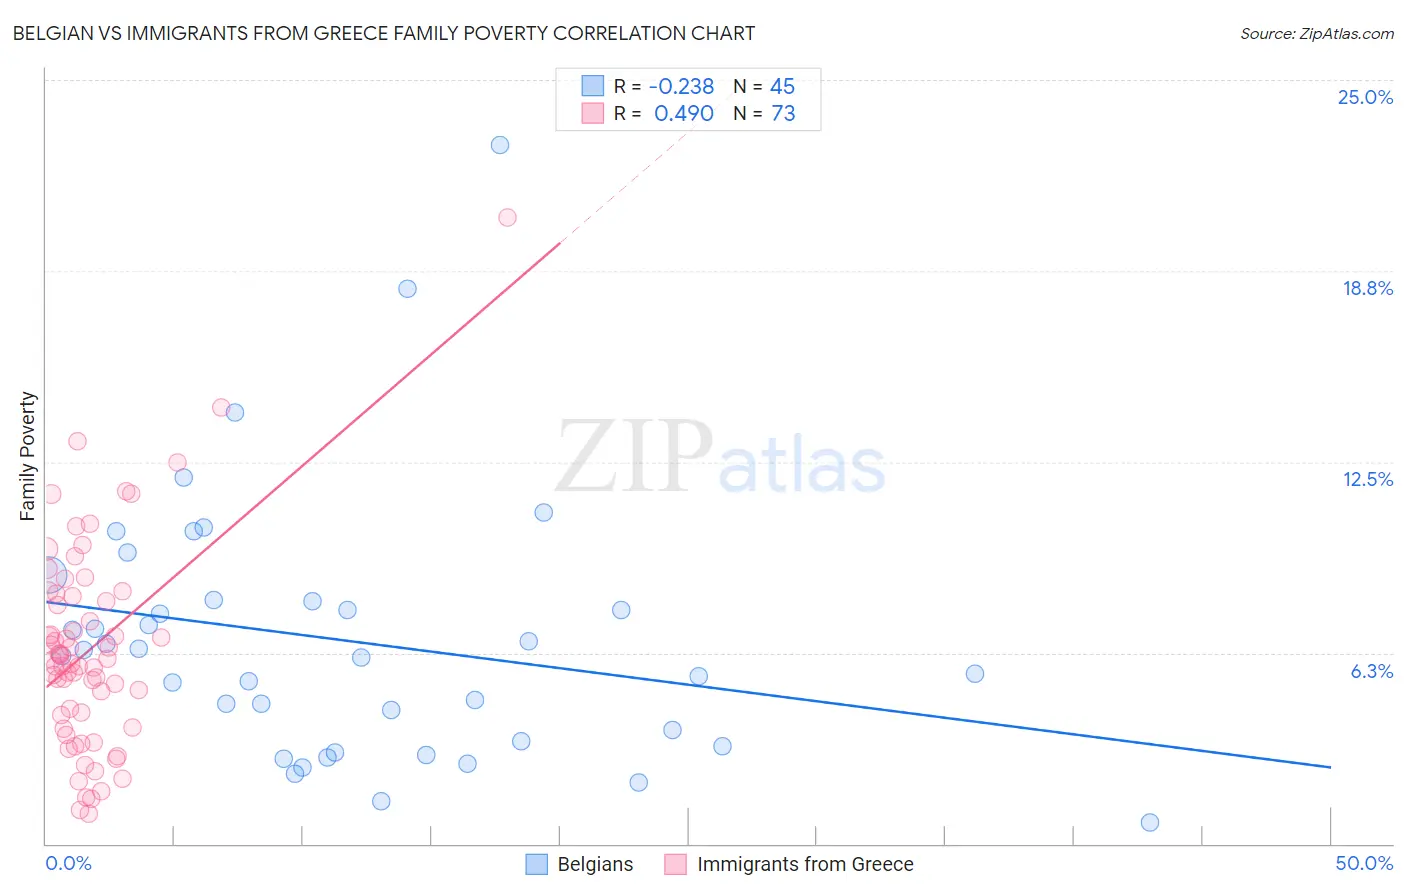
Belgian vs Immigrants from Greece Family Poverty Correlation Chart
The statistical analysis conducted on geographies consisting of 355,051,863 people shows a weak negative correlation between the proportion of Belgians and poverty level among families in the United States with a correlation coefficient (R) of -0.238 and weighted average of 8.0%. Similarly, the statistical analysis conducted on geographies consisting of 216,555,075 people shows a moderate positive correlation between the proportion of Immigrants from Greece and poverty level among families in the United States with a correlation coefficient (R) of 0.490 and weighted average of 7.7%, a difference of 2.8%.
Family Poverty Correlation Summary
| Measurement | Belgian | Immigrants from Greece |
| Minimum | 0.68% | 0.99% |
| Maximum | 22.9% | 20.5% |
| Range | 22.2% | 19.5% |
| Mean | 6.6% | 6.4% |
| Median | 6.2% | 6.0% |
| Interquartile 25% (IQ1) | 3.3% | 4.0% |
| Interquartile 75% (IQ3) | 8.0% | 8.1% |
| Interquartile Range (IQR) | 4.7% | 4.1% |
| Standard Deviation (Sample) | 4.3% | 3.4% |
| Standard Deviation (Population) | 4.2% | 3.4% |
Similar Demographics by Family Poverty
Demographics Similar to Belgians by Family Poverty
In terms of family poverty, the demographic groups most similar to Belgians are Serbian (8.0%, a difference of 0.070%), Scottish (7.9%, a difference of 0.090%), Immigrants from Asia (7.9%, a difference of 0.13%), Immigrants from Denmark (8.0%, a difference of 0.21%), and Immigrants from England (8.0%, a difference of 0.21%).
| Demographics | Rating | Rank | Family Poverty |
| English | 97.8 /100 | #80 | Exceptional 7.9% |
| Irish | 97.8 /100 | #81 | Exceptional 7.9% |
| Immigrants | Poland | 97.8 /100 | #82 | Exceptional 7.9% |
| Slovaks | 97.7 /100 | #83 | Exceptional 7.9% |
| British | 97.5 /100 | #84 | Exceptional 7.9% |
| Immigrants | Asia | 97.4 /100 | #85 | Exceptional 7.9% |
| Scottish | 97.3 /100 | #86 | Exceptional 7.9% |
| Belgians | 97.3 /100 | #87 | Exceptional 8.0% |
| Serbians | 97.2 /100 | #88 | Exceptional 8.0% |
| Immigrants | Denmark | 97.1 /100 | #89 | Exceptional 8.0% |
| Immigrants | England | 97.1 /100 | #90 | Exceptional 8.0% |
| Immigrants | Italy | 97.0 /100 | #91 | Exceptional 8.0% |
| Czechoslovakians | 96.8 /100 | #92 | Exceptional 8.0% |
| Tlingit-Haida | 96.7 /100 | #93 | Exceptional 8.0% |
| Immigrants | Pakistan | 96.6 /100 | #94 | Exceptional 8.0% |
Demographics Similar to Immigrants from Greece by Family Poverty
In terms of family poverty, the demographic groups most similar to Immigrants from Greece are European (7.7%, a difference of 0.010%), Finnish (7.7%, a difference of 0.020%), Asian (7.7%, a difference of 0.050%), Immigrants from Serbia (7.7%, a difference of 0.14%), and Immigrants from Eastern Asia (7.7%, a difference of 0.18%).
| Demographics | Rating | Rank | Family Poverty |
| Swiss | 98.8 /100 | #53 | Exceptional 7.7% |
| Immigrants | Sweden | 98.8 /100 | #54 | Exceptional 7.7% |
| Immigrants | Eastern Asia | 98.7 /100 | #55 | Exceptional 7.7% |
| Immigrants | Serbia | 98.7 /100 | #56 | Exceptional 7.7% |
| Asians | 98.7 /100 | #57 | Exceptional 7.7% |
| Finns | 98.7 /100 | #58 | Exceptional 7.7% |
| Europeans | 98.7 /100 | #59 | Exceptional 7.7% |
| Immigrants | Greece | 98.7 /100 | #60 | Exceptional 7.7% |
| Immigrants | Netherlands | 98.6 /100 | #61 | Exceptional 7.7% |
| Macedonians | 98.6 /100 | #62 | Exceptional 7.8% |
| Zimbabweans | 98.4 /100 | #63 | Exceptional 7.8% |
| Koreans | 98.3 /100 | #64 | Exceptional 7.8% |
| Immigrants | Bulgaria | 98.3 /100 | #65 | Exceptional 7.8% |
| Dutch | 98.3 /100 | #66 | Exceptional 7.8% |
| Northern Europeans | 98.3 /100 | #67 | Exceptional 7.8% |