European vs Immigrants from Greece Per Capita Income
COMPARE
European
Immigrants from Greece
Per Capita Income
Per Capita Income Comparison
Europeans
Immigrants from Greece
$45,836
PER CAPITA INCOME
92.0/ 100
METRIC RATING
124th/ 347
METRIC RANK
$51,891
PER CAPITA INCOME
100.0/ 100
METRIC RATING
36th/ 347
METRIC RANK
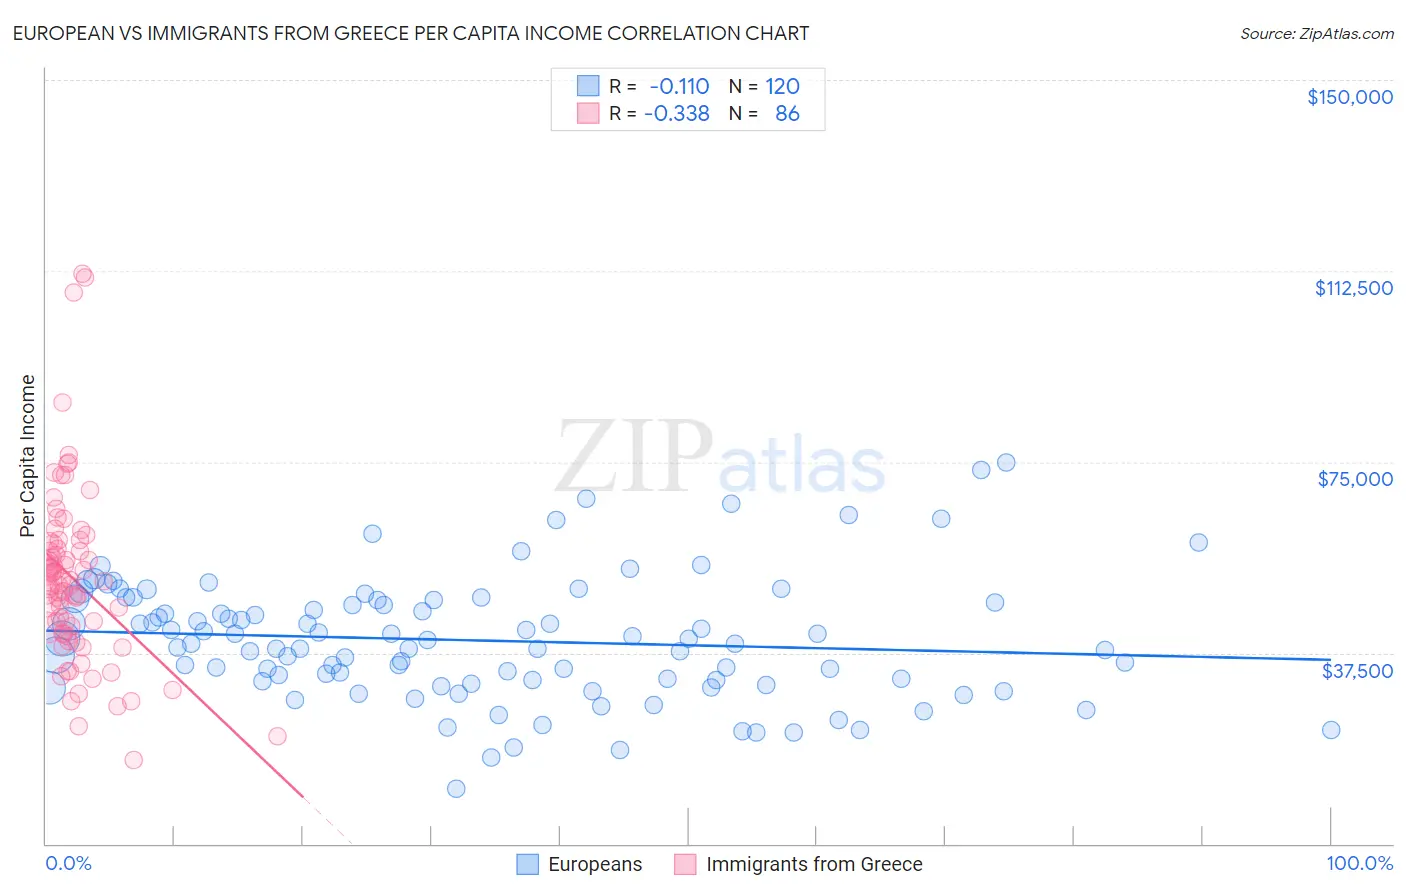
European vs Immigrants from Greece Per Capita Income Correlation Chart
The statistical analysis conducted on geographies consisting of 561,881,498 people shows a poor negative correlation between the proportion of Europeans and per capita income in the United States with a correlation coefficient (R) of -0.110 and weighted average of $45,836. Similarly, the statistical analysis conducted on geographies consisting of 216,879,011 people shows a mild negative correlation between the proportion of Immigrants from Greece and per capita income in the United States with a correlation coefficient (R) of -0.338 and weighted average of $51,891, a difference of 13.2%.
Per Capita Income Correlation Summary
| Measurement | European | Immigrants from Greece |
| Minimum | $10,710 | $16,481 |
| Maximum | $74,913 | $111,988 |
| Range | $64,203 | $95,507 |
| Mean | $39,928 | $52,082 |
| Median | $39,188 | $51,208 |
| Interquartile 25% (IQ1) | $32,091 | $41,348 |
| Interquartile 75% (IQ3) | $47,667 | $58,850 |
| Interquartile Range (IQR) | $15,576 | $17,502 |
| Standard Deviation (Sample) | $11,966 | $17,408 |
| Standard Deviation (Population) | $11,916 | $17,307 |
Similar Demographics by Per Capita Income
Demographics Similar to Europeans by Per Capita Income
In terms of per capita income, the demographic groups most similar to Europeans are Lebanese ($45,840, a difference of 0.010%), Moroccan ($45,854, a difference of 0.040%), Canadian ($45,858, a difference of 0.050%), Zimbabwean ($45,804, a difference of 0.070%), and Palestinian ($45,790, a difference of 0.10%).
| Demographics | Rating | Rank | Per Capita Income |
| Chinese | 93.9 /100 | #117 | Exceptional $46,098 |
| Immigrants | Saudi Arabia | 93.3 /100 | #118 | Exceptional $46,008 |
| Immigrants | Poland | 93.1 /100 | #119 | Exceptional $45,979 |
| Immigrants | Ethiopia | 92.7 /100 | #120 | Exceptional $45,923 |
| Canadians | 92.2 /100 | #121 | Exceptional $45,858 |
| Moroccans | 92.1 /100 | #122 | Exceptional $45,854 |
| Lebanese | 92.0 /100 | #123 | Exceptional $45,840 |
| Europeans | 92.0 /100 | #124 | Exceptional $45,836 |
| Zimbabweans | 91.7 /100 | #125 | Exceptional $45,804 |
| Palestinians | 91.6 /100 | #126 | Exceptional $45,790 |
| Immigrants | Germany | 91.3 /100 | #127 | Exceptional $45,751 |
| Swedes | 91.3 /100 | #128 | Exceptional $45,750 |
| Luxembourgers | 90.4 /100 | #129 | Exceptional $45,663 |
| Arabs | 90.4 /100 | #130 | Exceptional $45,662 |
| Immigrants | North Macedonia | 90.0 /100 | #131 | Exceptional $45,622 |
Demographics Similar to Immigrants from Greece by Per Capita Income
In terms of per capita income, the demographic groups most similar to Immigrants from Greece are Estonian ($51,875, a difference of 0.030%), Burmese ($52,005, a difference of 0.22%), Immigrants from Czechoslovakia ($51,770, a difference of 0.23%), Immigrants from Russia ($52,044, a difference of 0.29%), and Cambodian ($51,731, a difference of 0.31%).
| Demographics | Rating | Rank | Per Capita Income |
| Israelis | 100.0 /100 | #29 | Exceptional $52,596 |
| Immigrants | Austria | 100.0 /100 | #30 | Exceptional $52,503 |
| Turks | 100.0 /100 | #31 | Exceptional $52,391 |
| Immigrants | Norway | 100.0 /100 | #32 | Exceptional $52,217 |
| Australians | 100.0 /100 | #33 | Exceptional $52,074 |
| Immigrants | Russia | 100.0 /100 | #34 | Exceptional $52,044 |
| Burmese | 100.0 /100 | #35 | Exceptional $52,005 |
| Immigrants | Greece | 100.0 /100 | #36 | Exceptional $51,891 |
| Estonians | 100.0 /100 | #37 | Exceptional $51,875 |
| Immigrants | Czechoslovakia | 100.0 /100 | #38 | Exceptional $51,770 |
| Cambodians | 100.0 /100 | #39 | Exceptional $51,731 |
| Immigrants | Korea | 100.0 /100 | #40 | Exceptional $51,671 |
| Immigrants | South Africa | 100.0 /100 | #41 | Exceptional $51,465 |
| Immigrants | Turkey | 100.0 /100 | #42 | Exceptional $51,368 |
| Immigrants | Lithuania | 100.0 /100 | #43 | Exceptional $51,361 |