Belgian vs Immigrants from Greece Householder Income Under 25 years
COMPARE
Belgian
Immigrants from Greece
Householder Income Under 25 years
Householder Income Under 25 years Comparison
Belgians
Immigrants from Greece
$50,113
HOUSEHOLDER INCOME UNDER 25 YEARS
0.6/ 100
METRIC RATING
265th/ 347
METRIC RANK
$55,727
HOUSEHOLDER INCOME UNDER 25 YEARS
100.0/ 100
METRIC RATING
40th/ 347
METRIC RANK
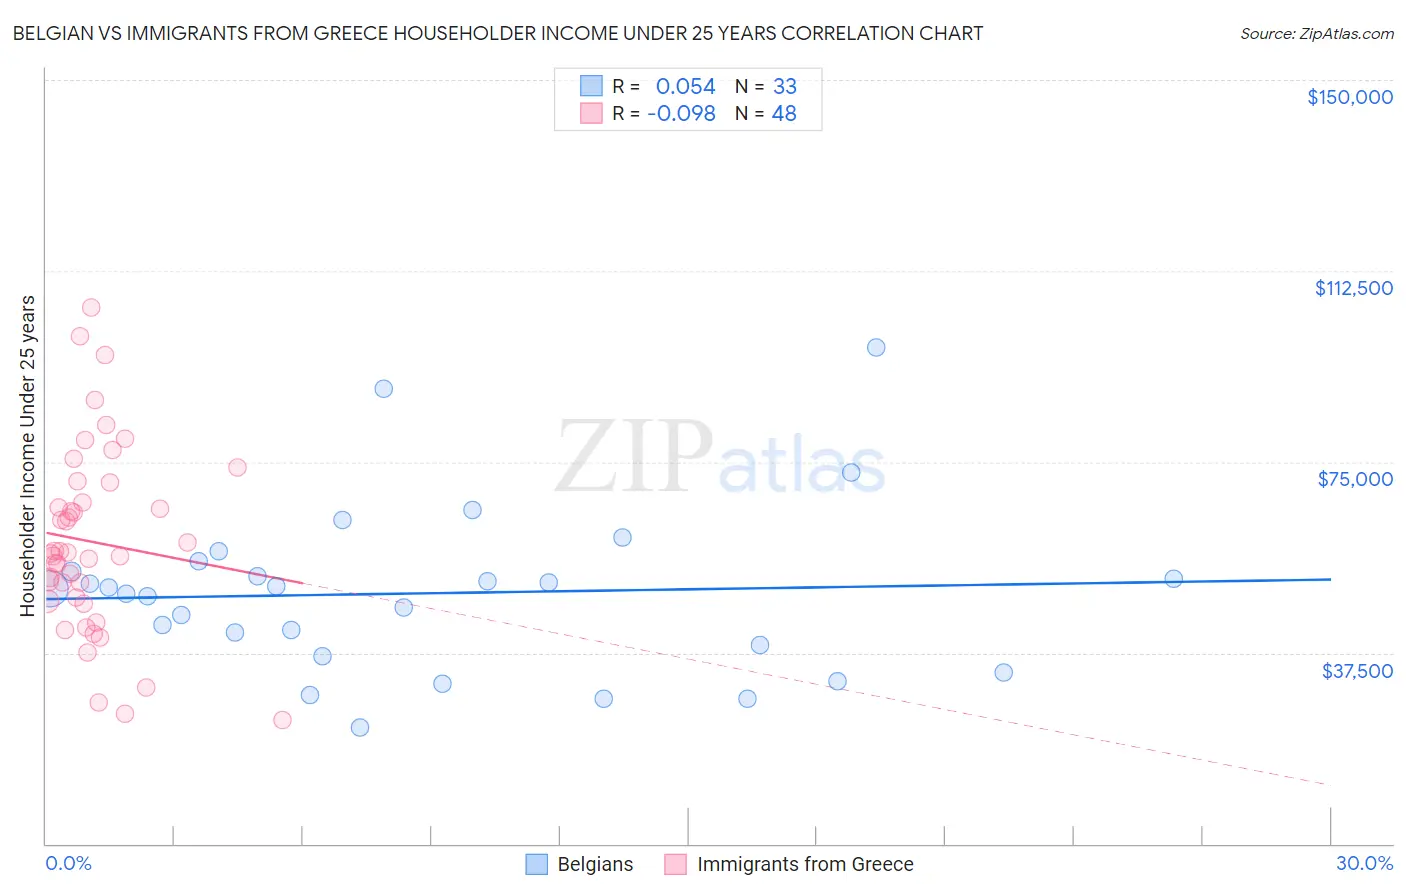
Belgian vs Immigrants from Greece Householder Income Under 25 years Correlation Chart
The statistical analysis conducted on geographies consisting of 302,930,390 people shows a slight positive correlation between the proportion of Belgians and household income with householder under the age of 25 in the United States with a correlation coefficient (R) of 0.054 and weighted average of $50,113. Similarly, the statistical analysis conducted on geographies consisting of 185,686,081 people shows a slight negative correlation between the proportion of Immigrants from Greece and household income with householder under the age of 25 in the United States with a correlation coefficient (R) of -0.098 and weighted average of $55,727, a difference of 11.2%.
Householder Income Under 25 years Correlation Summary
| Measurement | Belgian | Immigrants from Greece |
| Minimum | $22,948 | $24,293 |
| Maximum | $97,500 | $105,434 |
| Range | $74,552 | $81,141 |
| Mean | $49,189 | $59,276 |
| Median | $50,156 | $57,171 |
| Interquartile 25% (IQ1) | $38,023 | $47,996 |
| Interquartile 75% (IQ3) | $54,461 | $68,938 |
| Interquartile Range (IQR) | $16,438 | $20,942 |
| Standard Deviation (Sample) | $16,294 | $18,152 |
| Standard Deviation (Population) | $16,045 | $17,962 |
Similar Demographics by Householder Income Under 25 years
Demographics Similar to Belgians by Householder Income Under 25 years
In terms of householder income under 25 years, the demographic groups most similar to Belgians are Immigrants from Venezuela ($50,109, a difference of 0.010%), Fijian ($50,132, a difference of 0.040%), Immigrants from Laos ($50,041, a difference of 0.14%), Immigrants from Dominican Republic ($50,204, a difference of 0.18%), and Venezuelan ($50,011, a difference of 0.20%).
| Demographics | Rating | Rank | Householder Income Under 25 years |
| Whites/Caucasians | 1.1 /100 | #258 | Tragic $50,336 |
| Immigrants | Dominica | 1.0 /100 | #259 | Tragic $50,301 |
| Hispanics or Latinos | 0.9 /100 | #260 | Tragic $50,279 |
| Hungarians | 0.9 /100 | #261 | Tragic $50,247 |
| Haitians | 0.8 /100 | #262 | Tragic $50,231 |
| Immigrants | Dominican Republic | 0.8 /100 | #263 | Tragic $50,204 |
| Fijians | 0.6 /100 | #264 | Tragic $50,132 |
| Belgians | 0.6 /100 | #265 | Tragic $50,113 |
| Immigrants | Venezuela | 0.6 /100 | #266 | Tragic $50,109 |
| Immigrants | Laos | 0.5 /100 | #267 | Tragic $50,041 |
| Venezuelans | 0.5 /100 | #268 | Tragic $50,011 |
| Ute | 0.5 /100 | #269 | Tragic $49,997 |
| Mexicans | 0.5 /100 | #270 | Tragic $49,989 |
| Taiwanese | 0.3 /100 | #271 | Tragic $49,804 |
| Colville | 0.3 /100 | #272 | Tragic $49,774 |
Demographics Similar to Immigrants from Greece by Householder Income Under 25 years
In terms of householder income under 25 years, the demographic groups most similar to Immigrants from Greece are Immigrants from Guyana ($55,726, a difference of 0.0%), Immigrants from Korea ($55,716, a difference of 0.020%), Immigrants from South Eastern Asia ($55,714, a difference of 0.020%), Immigrants from Belarus ($55,743, a difference of 0.030%), and Paraguayan ($55,614, a difference of 0.20%).
| Demographics | Rating | Rank | Householder Income Under 25 years |
| Inupiat | 100.0 /100 | #33 | Exceptional $55,935 |
| Immigrants | Japan | 100.0 /100 | #34 | Exceptional $55,932 |
| Tlingit-Haida | 100.0 /100 | #35 | Exceptional $55,914 |
| Immigrants | Israel | 100.0 /100 | #36 | Exceptional $55,913 |
| Immigrants | Russia | 100.0 /100 | #37 | Exceptional $55,891 |
| Immigrants | Iran | 100.0 /100 | #38 | Exceptional $55,880 |
| Immigrants | Belarus | 100.0 /100 | #39 | Exceptional $55,743 |
| Immigrants | Greece | 100.0 /100 | #40 | Exceptional $55,727 |
| Immigrants | Guyana | 100.0 /100 | #41 | Exceptional $55,726 |
| Immigrants | Korea | 100.0 /100 | #42 | Exceptional $55,716 |
| Immigrants | South Eastern Asia | 100.0 /100 | #43 | Exceptional $55,714 |
| Paraguayans | 100.0 /100 | #44 | Exceptional $55,614 |
| Spanish American Indians | 100.0 /100 | #45 | Exceptional $55,573 |
| Immigrants | Eastern Europe | 100.0 /100 | #46 | Exceptional $55,572 |
| Cambodians | 100.0 /100 | #47 | Exceptional $55,571 |