Basque vs Immigrants from West Indies In Labor Force | Age 16-19
COMPARE
Basque
Immigrants from West Indies
In Labor Force | Age 16-19
In Labor Force | Age 16-19 Comparison
Basques
Immigrants from West Indies
39.3%
IN LABOR FORCE | AGE 16-19
99.7/ 100
METRIC RATING
82nd/ 347
METRIC RANK
31.7%
IN LABOR FORCE | AGE 16-19
0.0/ 100
METRIC RATING
315th/ 347
METRIC RANK
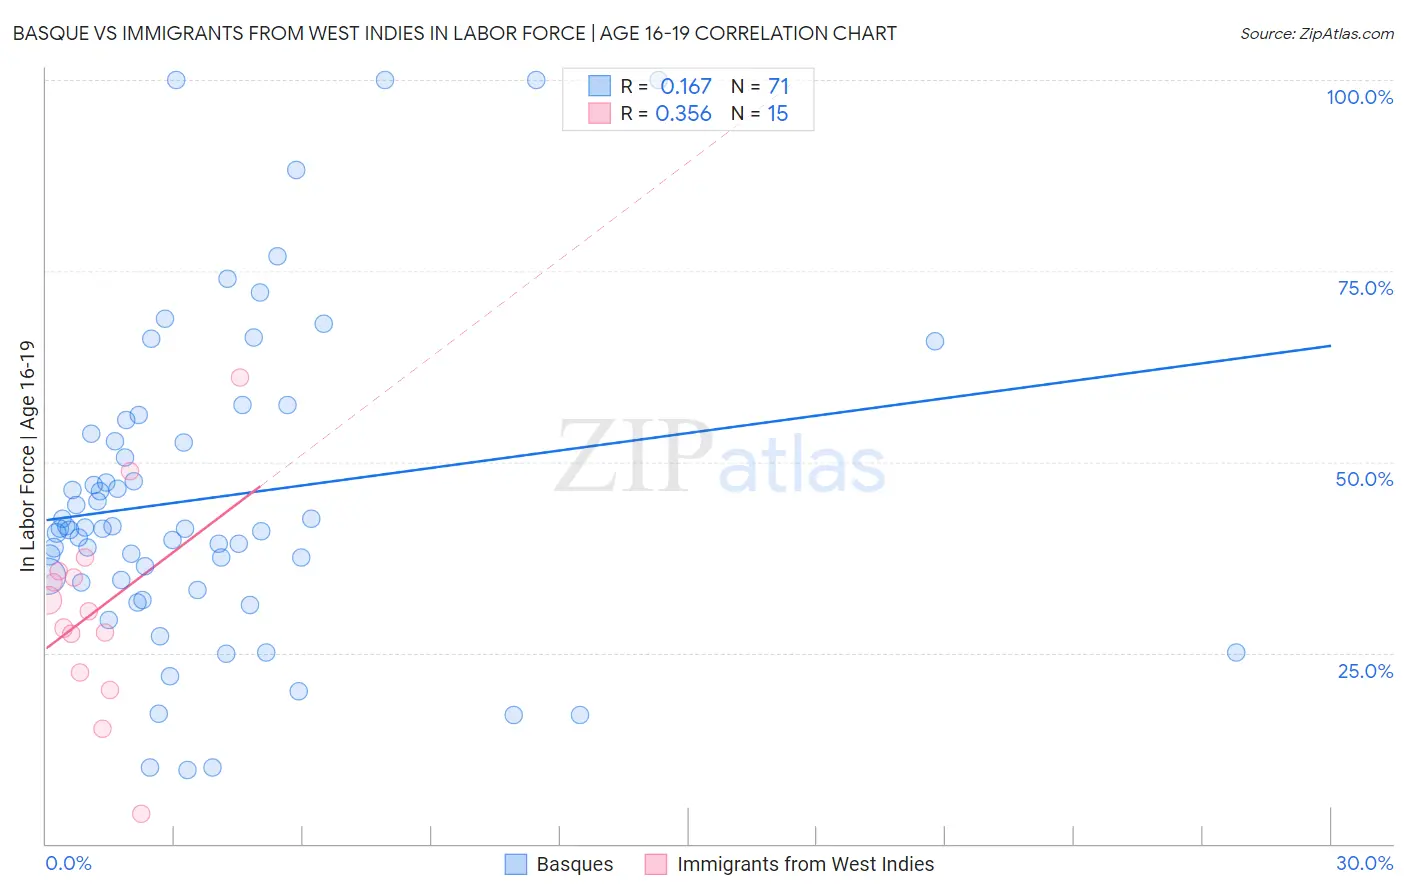
Basque vs Immigrants from West Indies In Labor Force | Age 16-19 Correlation Chart
The statistical analysis conducted on geographies consisting of 165,637,018 people shows a poor positive correlation between the proportion of Basques and labor force participation rate among population between the ages 16 and 19 in the United States with a correlation coefficient (R) of 0.167 and weighted average of 39.3%. Similarly, the statistical analysis conducted on geographies consisting of 72,428,382 people shows a mild positive correlation between the proportion of Immigrants from West Indies and labor force participation rate among population between the ages 16 and 19 in the United States with a correlation coefficient (R) of 0.356 and weighted average of 31.7%, a difference of 23.8%.
In Labor Force | Age 16-19 Correlation Summary
| Measurement | Basque | Immigrants from West Indies |
| Minimum | 9.7% | 3.9% |
| Maximum | 100.0% | 61.0% |
| Range | 90.3% | 57.1% |
| Mean | 45.3% | 30.6% |
| Median | 41.3% | 30.4% |
| Interquartile 25% (IQ1) | 34.2% | 22.4% |
| Interquartile 75% (IQ3) | 53.7% | 35.6% |
| Interquartile Range (IQR) | 19.5% | 13.3% |
| Standard Deviation (Sample) | 20.8% | 13.4% |
| Standard Deviation (Population) | 20.7% | 12.9% |
Similar Demographics by In Labor Force | Age 16-19
Demographics Similar to Basques by In Labor Force | Age 16-19
In terms of in labor force | age 16-19, the demographic groups most similar to Basques are Spanish (39.3%, a difference of 0.020%), Shoshone (39.3%, a difference of 0.060%), Immigrants from Uganda (39.2%, a difference of 0.15%), Creek (39.1%, a difference of 0.30%), and Samoan (39.1%, a difference of 0.32%).
| Demographics | Rating | Rank | In Labor Force | Age 16-19 |
| French American Indians | 99.9 /100 | #75 | Exceptional 39.8% |
| Malaysians | 99.9 /100 | #76 | Exceptional 39.7% |
| Immigrants | Portugal | 99.9 /100 | #77 | Exceptional 39.7% |
| Austrians | 99.8 /100 | #78 | Exceptional 39.5% |
| Marshallese | 99.8 /100 | #79 | Exceptional 39.5% |
| Immigrants | Iraq | 99.8 /100 | #80 | Exceptional 39.4% |
| Shoshone | 99.7 /100 | #81 | Exceptional 39.3% |
| Basques | 99.7 /100 | #82 | Exceptional 39.3% |
| Spanish | 99.7 /100 | #83 | Exceptional 39.3% |
| Immigrants | Uganda | 99.7 /100 | #84 | Exceptional 39.2% |
| Creek | 99.6 /100 | #85 | Exceptional 39.1% |
| Samoans | 99.6 /100 | #86 | Exceptional 39.1% |
| Immigrants | Germany | 99.6 /100 | #87 | Exceptional 39.1% |
| Puget Sound Salish | 99.6 /100 | #88 | Exceptional 39.1% |
| Alaska Natives | 99.6 /100 | #89 | Exceptional 39.1% |
Demographics Similar to Immigrants from West Indies by In Labor Force | Age 16-19
In terms of in labor force | age 16-19, the demographic groups most similar to Immigrants from West Indies are Filipino (31.7%, a difference of 0.080%), Cuban (31.8%, a difference of 0.18%), Immigrants from Nicaragua (31.6%, a difference of 0.28%), Immigrants from Belize (31.8%, a difference of 0.34%), and Hopi (31.8%, a difference of 0.34%).
| Demographics | Rating | Rank | In Labor Force | Age 16-19 |
| Navajo | 0.0 /100 | #308 | Tragic 32.1% |
| Immigrants | Eastern Asia | 0.0 /100 | #309 | Tragic 32.0% |
| Immigrants | Iran | 0.0 /100 | #310 | Tragic 32.0% |
| Indians (Asian) | 0.0 /100 | #311 | Tragic 31.9% |
| Immigrants | Belize | 0.0 /100 | #312 | Tragic 31.8% |
| Hopi | 0.0 /100 | #313 | Tragic 31.8% |
| Cubans | 0.0 /100 | #314 | Tragic 31.8% |
| Immigrants | West Indies | 0.0 /100 | #315 | Tragic 31.7% |
| Filipinos | 0.0 /100 | #316 | Tragic 31.7% |
| Immigrants | Nicaragua | 0.0 /100 | #317 | Tragic 31.6% |
| Immigrants | Yemen | 0.0 /100 | #318 | Tragic 31.5% |
| Soviet Union | 0.0 /100 | #319 | Tragic 31.4% |
| Ecuadorians | 0.0 /100 | #320 | Tragic 31.4% |
| West Indians | 0.0 /100 | #321 | Tragic 31.3% |
| Tohono O'odham | 0.0 /100 | #322 | Tragic 31.3% |