Basque vs Czechoslovakian Median Male Earnings
COMPARE
Basque
Czechoslovakian
Median Male Earnings
Median Male Earnings Comparison
Basques
Czechoslovakians
$55,370
MEDIAN MALE EARNINGS
70.3/ 100
METRIC RATING
160th/ 347
METRIC RANK
$55,382
MEDIAN MALE EARNINGS
70.5/ 100
METRIC RATING
158th/ 347
METRIC RANK
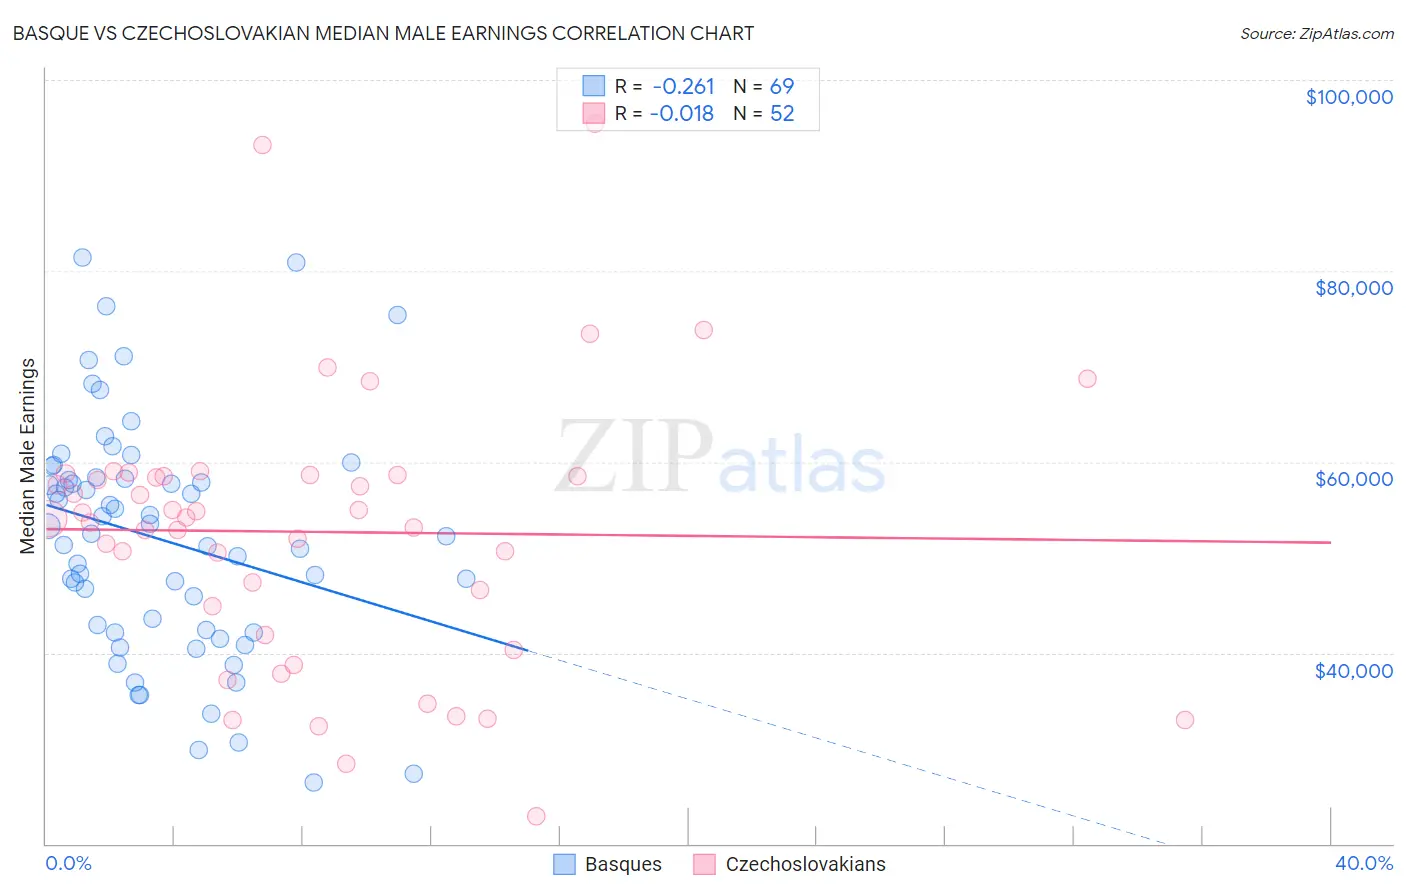
Basque vs Czechoslovakian Median Male Earnings Correlation Chart
The statistical analysis conducted on geographies consisting of 165,750,902 people shows a weak negative correlation between the proportion of Basques and median male earnings in the United States with a correlation coefficient (R) of -0.261 and weighted average of $55,370. Similarly, the statistical analysis conducted on geographies consisting of 368,529,148 people shows no correlation between the proportion of Czechoslovakians and median male earnings in the United States with a correlation coefficient (R) of -0.018 and weighted average of $55,382, a difference of 0.020%.
Median Male Earnings Correlation Summary
| Measurement | Basque | Czechoslovakian |
| Minimum | $26,442 | $22,917 |
| Maximum | $81,428 | $95,417 |
| Range | $54,986 | $72,500 |
| Mean | $51,886 | $52,664 |
| Median | $52,492 | $54,109 |
| Interquartile 25% (IQ1) | $42,224 | $43,411 |
| Interquartile 75% (IQ3) | $58,280 | $58,532 |
| Interquartile Range (IQR) | $16,056 | $15,121 |
| Standard Deviation (Sample) | $12,223 | $14,290 |
| Standard Deviation (Population) | $12,134 | $14,152 |
Demographics Similar to Basques and Czechoslovakians by Median Male Earnings
In terms of median male earnings, the demographic groups most similar to Basques are Alsatian ($55,380, a difference of 0.020%), Belgian ($55,361, a difference of 0.020%), French ($55,350, a difference of 0.040%), Icelander ($55,415, a difference of 0.080%), and Immigrants from Ethiopia ($55,434, a difference of 0.12%). Similarly, the demographic groups most similar to Czechoslovakians are Alsatian ($55,380, a difference of 0.0%), Belgian ($55,361, a difference of 0.040%), Icelander ($55,415, a difference of 0.060%), French ($55,350, a difference of 0.060%), and Immigrants from Ethiopia ($55,434, a difference of 0.090%).
| Demographics | Rating | Rank | Median Male Earnings |
| English | 77.4 /100 | #149 | Good $55,747 |
| Swiss | 77.1 /100 | #150 | Good $55,731 |
| Immigrants | Oceania | 76.8 /100 | #151 | Good $55,712 |
| Peruvians | 75.8 /100 | #152 | Good $55,659 |
| Immigrants | Nepal | 75.0 /100 | #153 | Good $55,615 |
| Taiwanese | 73.9 /100 | #154 | Good $55,556 |
| Scandinavians | 73.4 /100 | #155 | Good $55,527 |
| Immigrants | Ethiopia | 71.6 /100 | #156 | Good $55,434 |
| Icelanders | 71.2 /100 | #157 | Good $55,415 |
| Czechoslovakians | 70.5 /100 | #158 | Good $55,382 |
| Alsatians | 70.5 /100 | #159 | Good $55,380 |
| Basques | 70.3 /100 | #160 | Good $55,370 |
| Belgians | 70.1 /100 | #161 | Good $55,361 |
| French | 69.9 /100 | #162 | Good $55,350 |
| Ugandans | 68.6 /100 | #163 | Good $55,290 |
| Immigrants | South Eastern Asia | 67.6 /100 | #164 | Good $55,241 |
| Immigrants | Portugal | 66.3 /100 | #165 | Good $55,182 |
| Germans | 61.6 /100 | #166 | Good $54,974 |
| Immigrants | Fiji | 61.2 /100 | #167 | Good $54,958 |
| Immigrants | Vietnam | 60.2 /100 | #168 | Good $54,913 |
| French Canadians | 55.6 /100 | #169 | Average $54,722 |