Basque vs Pima Median Male Earnings
COMPARE
Basque
Pima
Median Male Earnings
Median Male Earnings Comparison
Basques
Pima
$55,370
MEDIAN MALE EARNINGS
70.3/ 100
METRIC RATING
160th/ 347
METRIC RANK
$42,357
MEDIAN MALE EARNINGS
0.0/ 100
METRIC RATING
339th/ 347
METRIC RANK
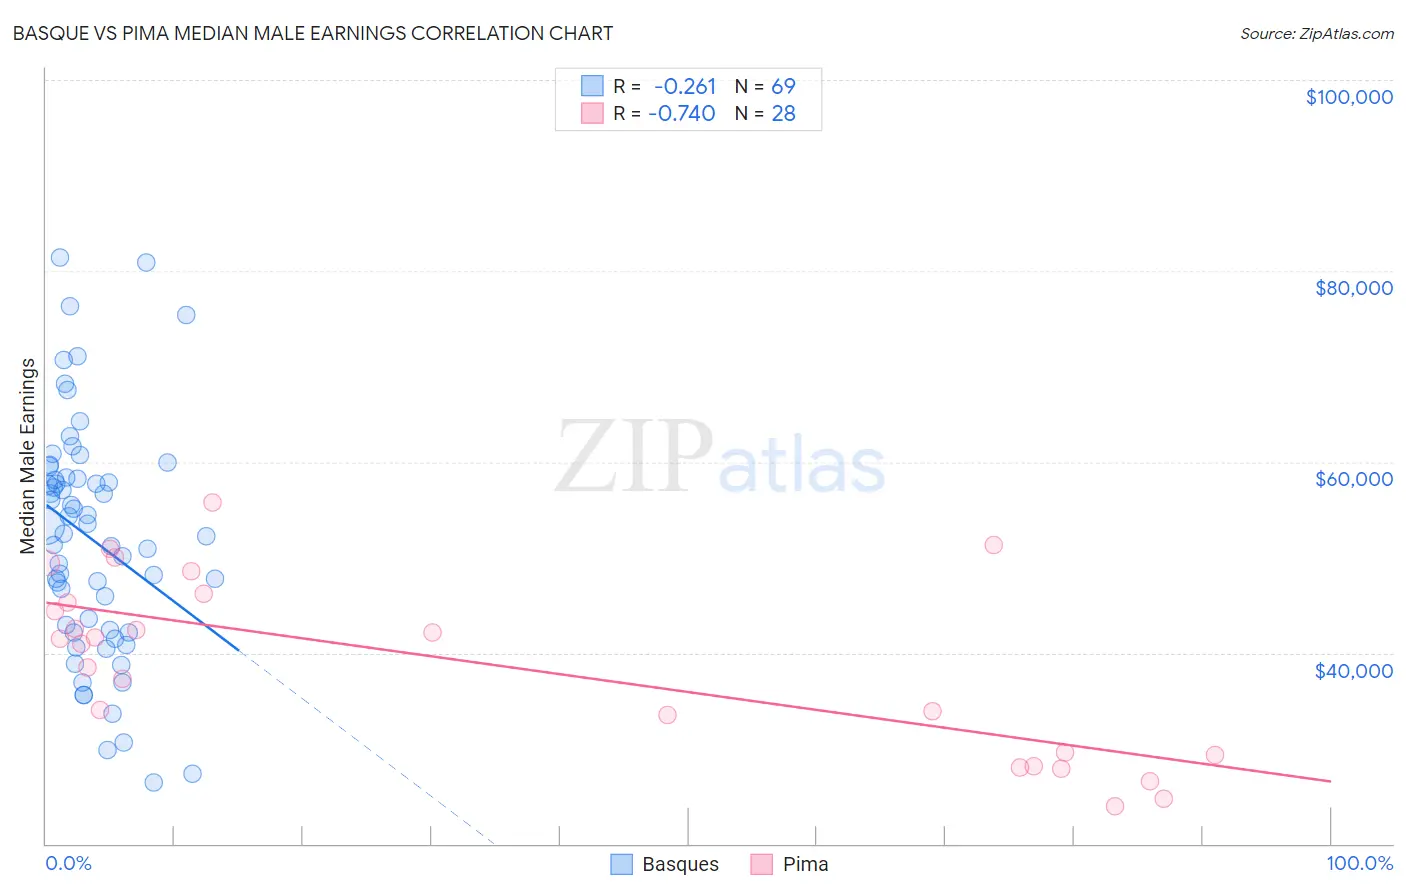
Basque vs Pima Median Male Earnings Correlation Chart
The statistical analysis conducted on geographies consisting of 165,750,902 people shows a weak negative correlation between the proportion of Basques and median male earnings in the United States with a correlation coefficient (R) of -0.261 and weighted average of $55,370. Similarly, the statistical analysis conducted on geographies consisting of 61,536,518 people shows a strong negative correlation between the proportion of Pima and median male earnings in the United States with a correlation coefficient (R) of -0.740 and weighted average of $42,357, a difference of 30.7%.
Median Male Earnings Correlation Summary
| Measurement | Basque | Pima |
| Minimum | $26,442 | $23,884 |
| Maximum | $81,428 | $55,769 |
| Range | $54,986 | $31,885 |
| Mean | $51,886 | $38,846 |
| Median | $52,492 | $41,189 |
| Interquartile 25% (IQ1) | $42,224 | $29,407 |
| Interquartile 75% (IQ3) | $58,280 | $45,710 |
| Interquartile Range (IQR) | $16,056 | $16,303 |
| Standard Deviation (Sample) | $12,223 | $9,196 |
| Standard Deviation (Population) | $12,134 | $9,031 |
Similar Demographics by Median Male Earnings
Demographics Similar to Basques by Median Male Earnings
In terms of median male earnings, the demographic groups most similar to Basques are Czechoslovakian ($55,382, a difference of 0.020%), Alsatian ($55,380, a difference of 0.020%), Belgian ($55,361, a difference of 0.020%), French ($55,350, a difference of 0.040%), and Icelander ($55,415, a difference of 0.080%).
| Demographics | Rating | Rank | Median Male Earnings |
| Immigrants | Nepal | 75.0 /100 | #153 | Good $55,615 |
| Taiwanese | 73.9 /100 | #154 | Good $55,556 |
| Scandinavians | 73.4 /100 | #155 | Good $55,527 |
| Immigrants | Ethiopia | 71.6 /100 | #156 | Good $55,434 |
| Icelanders | 71.2 /100 | #157 | Good $55,415 |
| Czechoslovakians | 70.5 /100 | #158 | Good $55,382 |
| Alsatians | 70.5 /100 | #159 | Good $55,380 |
| Basques | 70.3 /100 | #160 | Good $55,370 |
| Belgians | 70.1 /100 | #161 | Good $55,361 |
| French | 69.9 /100 | #162 | Good $55,350 |
| Ugandans | 68.6 /100 | #163 | Good $55,290 |
| Immigrants | South Eastern Asia | 67.6 /100 | #164 | Good $55,241 |
| Immigrants | Portugal | 66.3 /100 | #165 | Good $55,182 |
| Germans | 61.6 /100 | #166 | Good $54,974 |
| Immigrants | Fiji | 61.2 /100 | #167 | Good $54,958 |
Demographics Similar to Pima by Median Male Earnings
In terms of median male earnings, the demographic groups most similar to Pima are Crow ($42,434, a difference of 0.18%), Menominee ($42,581, a difference of 0.53%), Navajo ($42,098, a difference of 0.62%), Hopi ($42,060, a difference of 0.71%), and Arapaho ($41,758, a difference of 1.4%).
| Demographics | Rating | Rank | Median Male Earnings |
| Bahamians | 0.0 /100 | #332 | Tragic $44,756 |
| Immigrants | Congo | 0.0 /100 | #333 | Tragic $44,204 |
| Immigrants | Yemen | 0.0 /100 | #334 | Tragic $44,083 |
| Spanish American Indians | 0.0 /100 | #335 | Tragic $44,010 |
| Immigrants | Cuba | 0.0 /100 | #336 | Tragic $43,461 |
| Menominee | 0.0 /100 | #337 | Tragic $42,581 |
| Crow | 0.0 /100 | #338 | Tragic $42,434 |
| Pima | 0.0 /100 | #339 | Tragic $42,357 |
| Navajo | 0.0 /100 | #340 | Tragic $42,098 |
| Hopi | 0.0 /100 | #341 | Tragic $42,060 |
| Arapaho | 0.0 /100 | #342 | Tragic $41,758 |
| Lumbee | 0.0 /100 | #343 | Tragic $41,715 |
| Pueblo | 0.0 /100 | #344 | Tragic $41,314 |
| Puerto Ricans | 0.0 /100 | #345 | Tragic $40,071 |
| Tohono O'odham | 0.0 /100 | #346 | Tragic $39,543 |