Basque vs Comanche Median Male Earnings
COMPARE
Basque
Comanche
Median Male Earnings
Median Male Earnings Comparison
Basques
Comanche
$55,370
MEDIAN MALE EARNINGS
70.3/ 100
METRIC RATING
160th/ 347
METRIC RANK
$48,202
MEDIAN MALE EARNINGS
0.2/ 100
METRIC RATING
280th/ 347
METRIC RANK
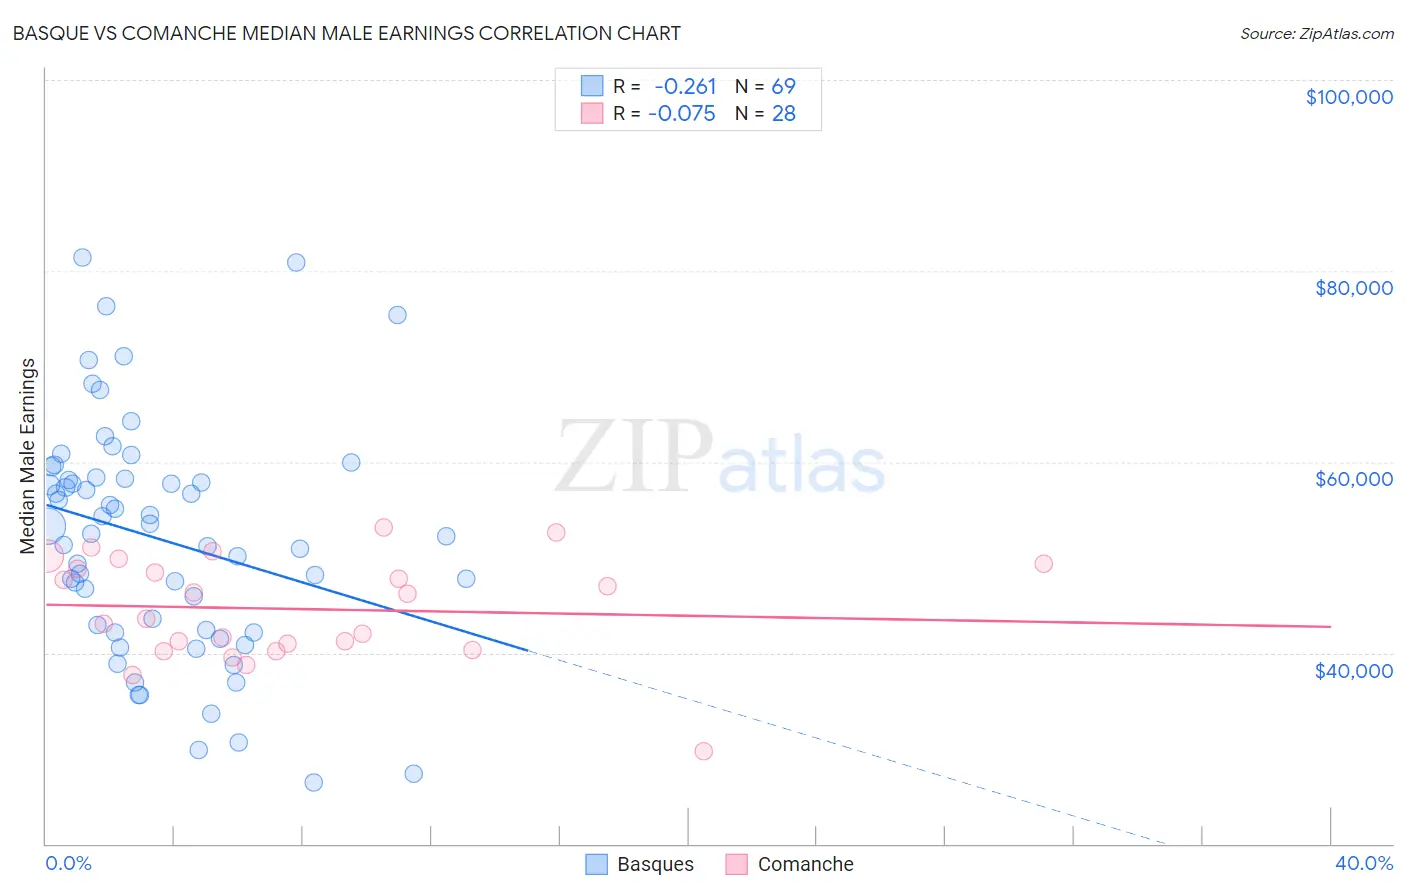
Basque vs Comanche Median Male Earnings Correlation Chart
The statistical analysis conducted on geographies consisting of 165,750,902 people shows a weak negative correlation between the proportion of Basques and median male earnings in the United States with a correlation coefficient (R) of -0.261 and weighted average of $55,370. Similarly, the statistical analysis conducted on geographies consisting of 109,761,350 people shows a slight negative correlation between the proportion of Comanche and median male earnings in the United States with a correlation coefficient (R) of -0.075 and weighted average of $48,202, a difference of 14.9%.
Median Male Earnings Correlation Summary
| Measurement | Basque | Comanche |
| Minimum | $26,442 | $29,698 |
| Maximum | $81,428 | $53,182 |
| Range | $54,986 | $23,484 |
| Mean | $51,886 | $44,594 |
| Median | $52,492 | $44,855 |
| Interquartile 25% (IQ1) | $42,224 | $40,605 |
| Interquartile 75% (IQ3) | $58,280 | $49,111 |
| Interquartile Range (IQR) | $16,056 | $8,506 |
| Standard Deviation (Sample) | $12,223 | $5,459 |
| Standard Deviation (Population) | $12,134 | $5,361 |
Similar Demographics by Median Male Earnings
Demographics Similar to Basques by Median Male Earnings
In terms of median male earnings, the demographic groups most similar to Basques are Czechoslovakian ($55,382, a difference of 0.020%), Alsatian ($55,380, a difference of 0.020%), Belgian ($55,361, a difference of 0.020%), French ($55,350, a difference of 0.040%), and Icelander ($55,415, a difference of 0.080%).
| Demographics | Rating | Rank | Median Male Earnings |
| Immigrants | Nepal | 75.0 /100 | #153 | Good $55,615 |
| Taiwanese | 73.9 /100 | #154 | Good $55,556 |
| Scandinavians | 73.4 /100 | #155 | Good $55,527 |
| Immigrants | Ethiopia | 71.6 /100 | #156 | Good $55,434 |
| Icelanders | 71.2 /100 | #157 | Good $55,415 |
| Czechoslovakians | 70.5 /100 | #158 | Good $55,382 |
| Alsatians | 70.5 /100 | #159 | Good $55,380 |
| Basques | 70.3 /100 | #160 | Good $55,370 |
| Belgians | 70.1 /100 | #161 | Good $55,361 |
| French | 69.9 /100 | #162 | Good $55,350 |
| Ugandans | 68.6 /100 | #163 | Good $55,290 |
| Immigrants | South Eastern Asia | 67.6 /100 | #164 | Good $55,241 |
| Immigrants | Portugal | 66.3 /100 | #165 | Good $55,182 |
| Germans | 61.6 /100 | #166 | Good $54,974 |
| Immigrants | Fiji | 61.2 /100 | #167 | Good $54,958 |
Demographics Similar to Comanche by Median Male Earnings
In terms of median male earnings, the demographic groups most similar to Comanche are Hmong ($48,254, a difference of 0.11%), Marshallese ($48,137, a difference of 0.13%), Central American ($48,093, a difference of 0.23%), Immigrants from Liberia ($48,317, a difference of 0.24%), and Belizean ($48,358, a difference of 0.32%).
| Demographics | Rating | Rank | Median Male Earnings |
| Jamaicans | 0.3 /100 | #273 | Tragic $48,632 |
| Colville | 0.3 /100 | #274 | Tragic $48,516 |
| Immigrants | Somalia | 0.3 /100 | #275 | Tragic $48,439 |
| Blackfeet | 0.3 /100 | #276 | Tragic $48,402 |
| Belizeans | 0.2 /100 | #277 | Tragic $48,358 |
| Immigrants | Liberia | 0.2 /100 | #278 | Tragic $48,317 |
| Hmong | 0.2 /100 | #279 | Tragic $48,254 |
| Comanche | 0.2 /100 | #280 | Tragic $48,202 |
| Marshallese | 0.2 /100 | #281 | Tragic $48,137 |
| Central Americans | 0.2 /100 | #282 | Tragic $48,093 |
| Immigrants | Jamaica | 0.2 /100 | #283 | Tragic $48,040 |
| Africans | 0.2 /100 | #284 | Tragic $47,994 |
| Paiute | 0.2 /100 | #285 | Tragic $47,991 |
| Mexican American Indians | 0.2 /100 | #286 | Tragic $47,990 |
| Immigrants | El Salvador | 0.2 /100 | #287 | Tragic $47,973 |