Bahamian vs Sudanese Median Earnings
COMPARE
Bahamian
Sudanese
Median Earnings
Median Earnings Comparison
Bahamians
Sudanese
$39,735
MEDIAN EARNINGS
0.0/ 100
METRIC RATING
323rd/ 347
METRIC RANK
$44,419
MEDIAN EARNINGS
5.6/ 100
METRIC RATING
238th/ 347
METRIC RANK
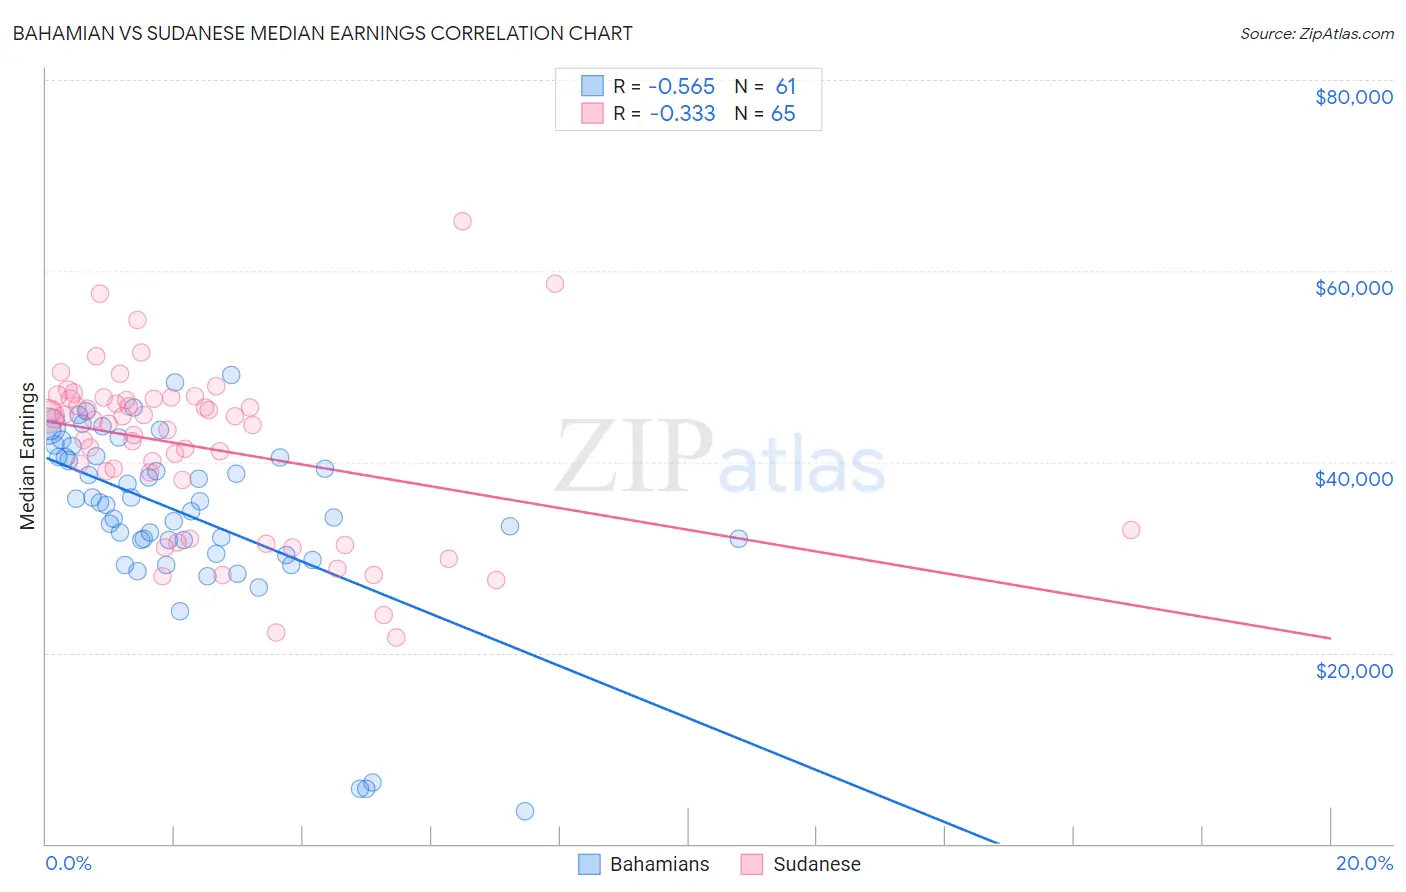
Bahamian vs Sudanese Median Earnings Correlation Chart
The statistical analysis conducted on geographies consisting of 112,703,764 people shows a substantial negative correlation between the proportion of Bahamians and median earnings in the United States with a correlation coefficient (R) of -0.565 and weighted average of $39,735. Similarly, the statistical analysis conducted on geographies consisting of 110,129,376 people shows a mild negative correlation between the proportion of Sudanese and median earnings in the United States with a correlation coefficient (R) of -0.333 and weighted average of $44,419, a difference of 11.8%.
Median Earnings Correlation Summary
| Measurement | Bahamian | Sudanese |
| Minimum | $3,467 | $21,638 |
| Maximum | $49,150 | $65,192 |
| Range | $45,683 | $43,554 |
| Mean | $34,478 | $41,590 |
| Median | $35,694 | $44,417 |
| Interquartile 25% (IQ1) | $31,085 | $35,456 |
| Interquartile 75% (IQ3) | $40,552 | $46,591 |
| Interquartile Range (IQR) | $9,467 | $11,136 |
| Standard Deviation (Sample) | $9,647 | $8,811 |
| Standard Deviation (Population) | $9,567 | $8,743 |
Similar Demographics by Median Earnings
Demographics Similar to Bahamians by Median Earnings
In terms of median earnings, the demographic groups most similar to Bahamians are Ottawa ($39,721, a difference of 0.040%), Immigrants from Central America ($39,762, a difference of 0.070%), Creek ($39,648, a difference of 0.22%), Mexican ($39,834, a difference of 0.25%), and Immigrants from Bahamas ($39,861, a difference of 0.32%).
| Demographics | Rating | Rank | Median Earnings |
| Immigrants | Honduras | 0.0 /100 | #316 | Tragic $40,195 |
| Fijians | 0.0 /100 | #317 | Tragic $40,193 |
| Dutch West Indians | 0.0 /100 | #318 | Tragic $40,107 |
| Blacks/African Americans | 0.0 /100 | #319 | Tragic $40,085 |
| Immigrants | Bahamas | 0.0 /100 | #320 | Tragic $39,861 |
| Mexicans | 0.0 /100 | #321 | Tragic $39,834 |
| Immigrants | Central America | 0.0 /100 | #322 | Tragic $39,762 |
| Bahamians | 0.0 /100 | #323 | Tragic $39,735 |
| Ottawa | 0.0 /100 | #324 | Tragic $39,721 |
| Creek | 0.0 /100 | #325 | Tragic $39,648 |
| Immigrants | Yemen | 0.0 /100 | #326 | Tragic $39,540 |
| Yuman | 0.0 /100 | #327 | Tragic $39,523 |
| Sioux | 0.0 /100 | #328 | Tragic $39,448 |
| Kiowa | 0.0 /100 | #329 | Tragic $39,232 |
| Immigrants | Congo | 0.0 /100 | #330 | Tragic $39,169 |
Demographics Similar to Sudanese by Median Earnings
In terms of median earnings, the demographic groups most similar to Sudanese are Immigrants from Ecuador ($44,462, a difference of 0.10%), Senegalese ($44,373, a difference of 0.10%), British West Indian ($44,552, a difference of 0.30%), Venezuelan ($44,580, a difference of 0.36%), and Aleut ($44,241, a difference of 0.40%).
| Demographics | Rating | Rank | Median Earnings |
| Japanese | 9.5 /100 | #231 | Tragic $44,825 |
| Delaware | 9.0 /100 | #232 | Tragic $44,783 |
| Immigrants | Sudan | 8.8 /100 | #233 | Tragic $44,767 |
| Cape Verdeans | 7.5 /100 | #234 | Tragic $44,640 |
| Venezuelans | 6.9 /100 | #235 | Tragic $44,580 |
| British West Indians | 6.7 /100 | #236 | Tragic $44,552 |
| Immigrants | Ecuador | 5.9 /100 | #237 | Tragic $44,462 |
| Sudanese | 5.6 /100 | #238 | Tragic $44,419 |
| Senegalese | 5.3 /100 | #239 | Tragic $44,373 |
| Aleuts | 4.4 /100 | #240 | Tragic $44,241 |
| Samoans | 4.2 /100 | #241 | Tragic $44,206 |
| Immigrants | Venezuela | 4.0 /100 | #242 | Tragic $44,163 |
| Sub-Saharan Africans | 3.7 /100 | #243 | Tragic $44,118 |
| Immigrants | Nonimmigrants | 3.7 /100 | #244 | Tragic $44,117 |
| Immigrants | Burma/Myanmar | 3.2 /100 | #245 | Tragic $43,998 |