New Zealander vs Sudanese Median Earnings
COMPARE
New Zealander
Sudanese
Median Earnings
Median Earnings Comparison
New Zealanders
Sudanese
$51,246
MEDIAN EARNINGS
99.9/ 100
METRIC RATING
64th/ 347
METRIC RANK
$44,419
MEDIAN EARNINGS
5.6/ 100
METRIC RATING
238th/ 347
METRIC RANK
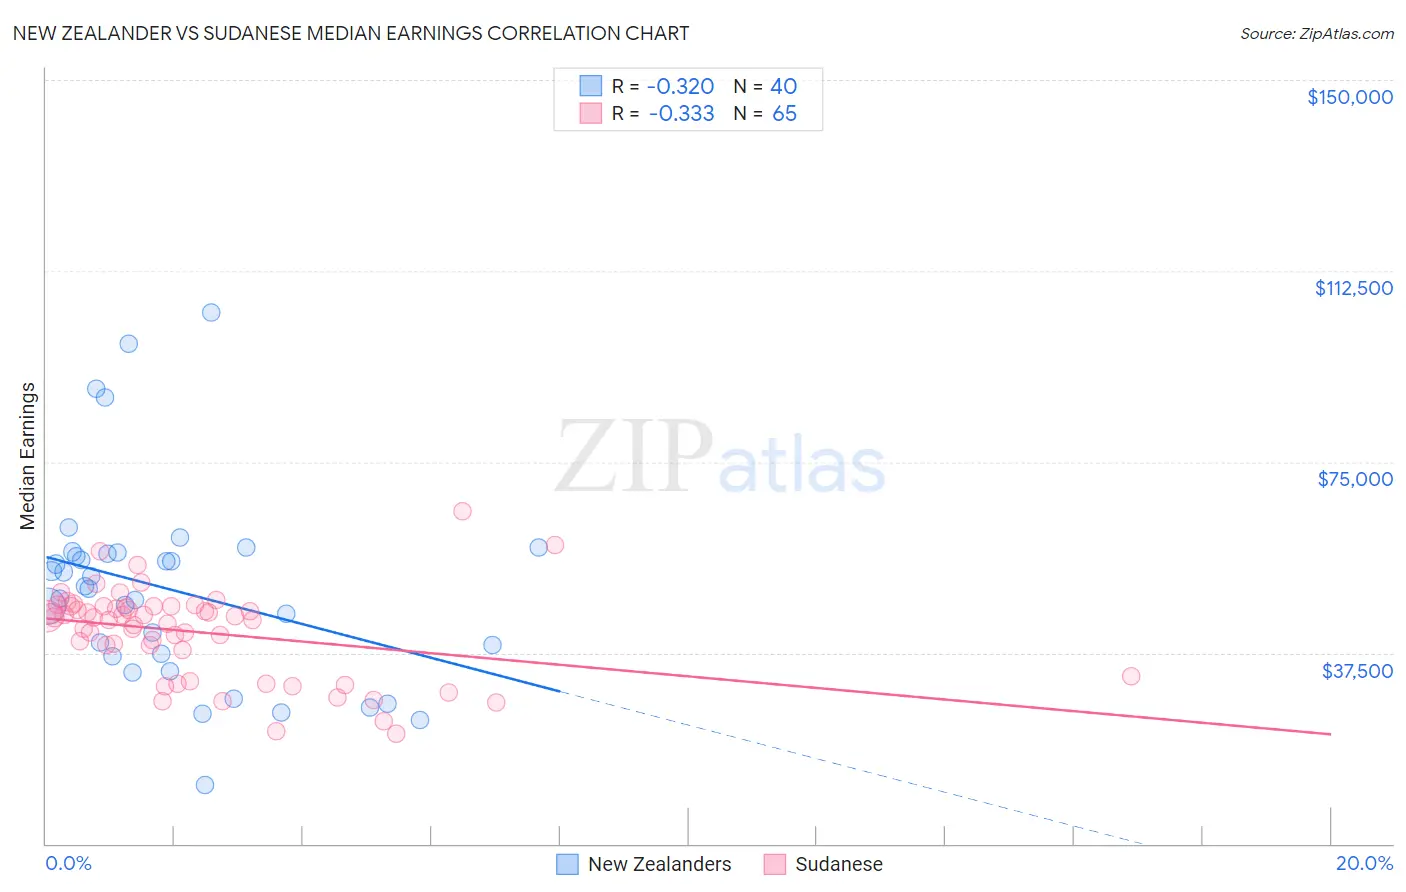
New Zealander vs Sudanese Median Earnings Correlation Chart
The statistical analysis conducted on geographies consisting of 106,916,811 people shows a mild negative correlation between the proportion of New Zealanders and median earnings in the United States with a correlation coefficient (R) of -0.320 and weighted average of $51,246. Similarly, the statistical analysis conducted on geographies consisting of 110,129,376 people shows a mild negative correlation between the proportion of Sudanese and median earnings in the United States with a correlation coefficient (R) of -0.333 and weighted average of $44,419, a difference of 15.4%.
Median Earnings Correlation Summary
| Measurement | New Zealander | Sudanese |
| Minimum | $11,591 | $21,638 |
| Maximum | $104,409 | $65,192 |
| Range | $92,818 | $43,554 |
| Mean | $49,845 | $41,590 |
| Median | $50,398 | $44,417 |
| Interquartile 25% (IQ1) | $37,107 | $35,456 |
| Interquartile 75% (IQ3) | $57,034 | $46,591 |
| Interquartile Range (IQR) | $19,927 | $11,136 |
| Standard Deviation (Sample) | $19,630 | $8,811 |
| Standard Deviation (Population) | $19,383 | $8,743 |
Similar Demographics by Median Earnings
Demographics Similar to New Zealanders by Median Earnings
In terms of median earnings, the demographic groups most similar to New Zealanders are Immigrants from Bulgaria ($51,318, a difference of 0.14%), Greek ($51,164, a difference of 0.16%), Immigrants from Romania ($51,337, a difference of 0.18%), Afghan ($51,112, a difference of 0.26%), and Immigrants from Spain ($51,092, a difference of 0.30%).
| Demographics | Rating | Rank | Median Earnings |
| Immigrants | Eastern Europe | 99.9 /100 | #57 | Exceptional $51,624 |
| Immigrants | Bolivia | 99.9 /100 | #58 | Exceptional $51,605 |
| Immigrants | Croatia | 99.9 /100 | #59 | Exceptional $51,581 |
| Immigrants | Serbia | 99.9 /100 | #60 | Exceptional $51,557 |
| Immigrants | Latvia | 99.9 /100 | #61 | Exceptional $51,555 |
| Immigrants | Romania | 99.9 /100 | #62 | Exceptional $51,337 |
| Immigrants | Bulgaria | 99.9 /100 | #63 | Exceptional $51,318 |
| New Zealanders | 99.9 /100 | #64 | Exceptional $51,246 |
| Greeks | 99.9 /100 | #65 | Exceptional $51,164 |
| Afghans | 99.9 /100 | #66 | Exceptional $51,112 |
| Immigrants | Spain | 99.9 /100 | #67 | Exceptional $51,092 |
| Paraguayans | 99.9 /100 | #68 | Exceptional $51,068 |
| Mongolians | 99.8 /100 | #69 | Exceptional $51,038 |
| Lithuanians | 99.8 /100 | #70 | Exceptional $50,991 |
| Immigrants | Ukraine | 99.8 /100 | #71 | Exceptional $50,984 |
Demographics Similar to Sudanese by Median Earnings
In terms of median earnings, the demographic groups most similar to Sudanese are Immigrants from Ecuador ($44,462, a difference of 0.10%), Senegalese ($44,373, a difference of 0.10%), British West Indian ($44,552, a difference of 0.30%), Venezuelan ($44,580, a difference of 0.36%), and Aleut ($44,241, a difference of 0.40%).
| Demographics | Rating | Rank | Median Earnings |
| Japanese | 9.5 /100 | #231 | Tragic $44,825 |
| Delaware | 9.0 /100 | #232 | Tragic $44,783 |
| Immigrants | Sudan | 8.8 /100 | #233 | Tragic $44,767 |
| Cape Verdeans | 7.5 /100 | #234 | Tragic $44,640 |
| Venezuelans | 6.9 /100 | #235 | Tragic $44,580 |
| British West Indians | 6.7 /100 | #236 | Tragic $44,552 |
| Immigrants | Ecuador | 5.9 /100 | #237 | Tragic $44,462 |
| Sudanese | 5.6 /100 | #238 | Tragic $44,419 |
| Senegalese | 5.3 /100 | #239 | Tragic $44,373 |
| Aleuts | 4.4 /100 | #240 | Tragic $44,241 |
| Samoans | 4.2 /100 | #241 | Tragic $44,206 |
| Immigrants | Venezuela | 4.0 /100 | #242 | Tragic $44,163 |
| Sub-Saharan Africans | 3.7 /100 | #243 | Tragic $44,118 |
| Immigrants | Nonimmigrants | 3.7 /100 | #244 | Tragic $44,117 |
| Immigrants | Burma/Myanmar | 3.2 /100 | #245 | Tragic $43,998 |