Bahamian vs Osage Median Earnings
COMPARE
Bahamian
Osage
Median Earnings
Median Earnings Comparison
Bahamians
Osage
$39,735
MEDIAN EARNINGS
0.0/ 100
METRIC RATING
323rd/ 347
METRIC RANK
$42,651
MEDIAN EARNINGS
0.5/ 100
METRIC RATING
270th/ 347
METRIC RANK
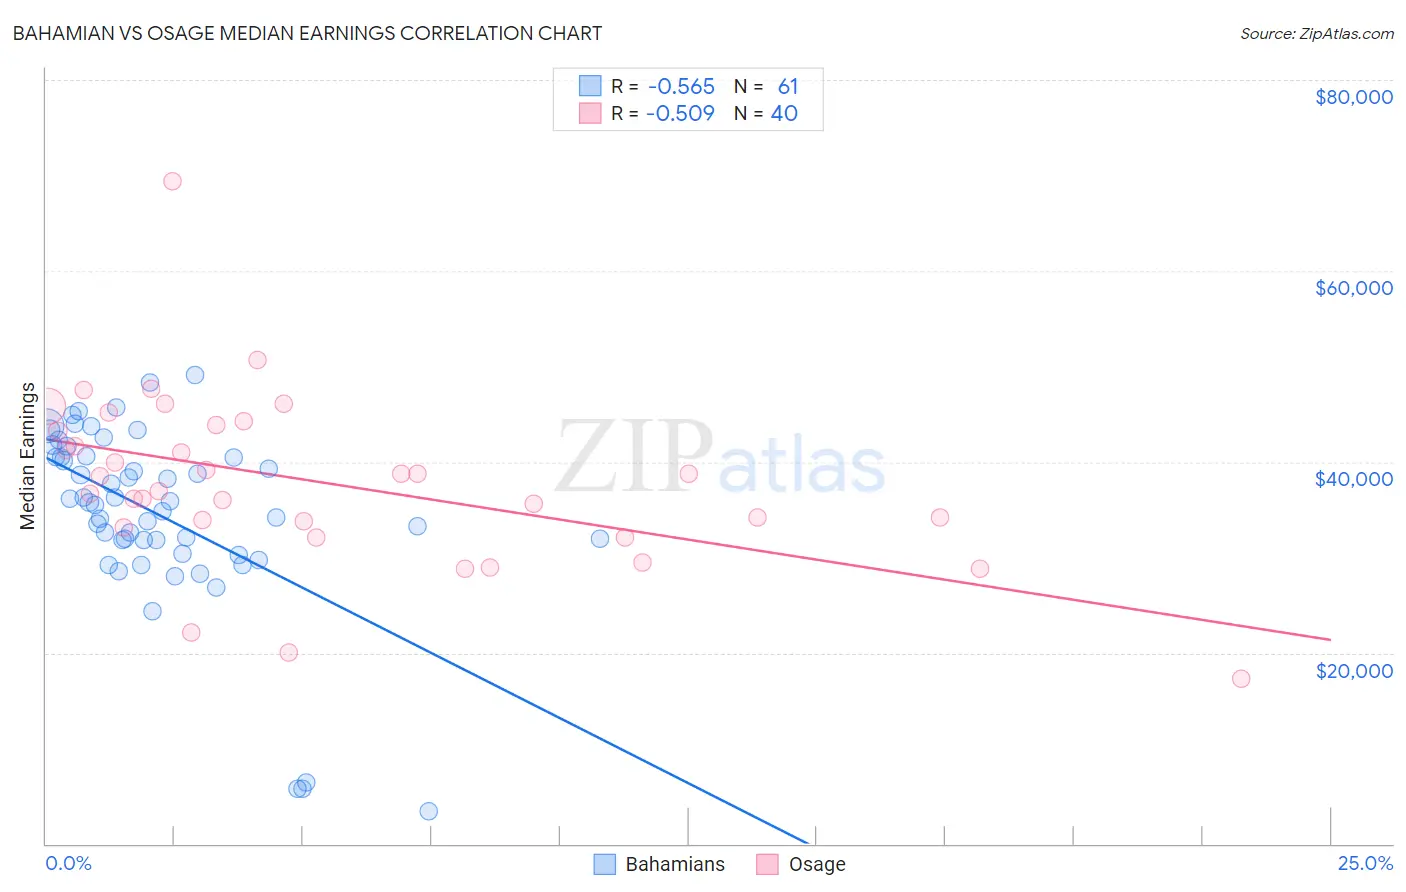
Bahamian vs Osage Median Earnings Correlation Chart
The statistical analysis conducted on geographies consisting of 112,703,764 people shows a substantial negative correlation between the proportion of Bahamians and median earnings in the United States with a correlation coefficient (R) of -0.565 and weighted average of $39,735. Similarly, the statistical analysis conducted on geographies consisting of 91,804,179 people shows a substantial negative correlation between the proportion of Osage and median earnings in the United States with a correlation coefficient (R) of -0.509 and weighted average of $42,651, a difference of 7.3%.
Median Earnings Correlation Summary
| Measurement | Bahamian | Osage |
| Minimum | $3,467 | $17,308 |
| Maximum | $49,150 | $69,422 |
| Range | $45,683 | $52,114 |
| Mean | $34,478 | $37,848 |
| Median | $35,694 | $37,712 |
| Interquartile 25% (IQ1) | $31,085 | $33,454 |
| Interquartile 75% (IQ3) | $40,552 | $43,538 |
| Interquartile Range (IQR) | $9,467 | $10,084 |
| Standard Deviation (Sample) | $9,647 | $9,089 |
| Standard Deviation (Population) | $9,567 | $8,975 |
Similar Demographics by Median Earnings
Demographics Similar to Bahamians by Median Earnings
In terms of median earnings, the demographic groups most similar to Bahamians are Ottawa ($39,721, a difference of 0.040%), Immigrants from Central America ($39,762, a difference of 0.070%), Creek ($39,648, a difference of 0.22%), Mexican ($39,834, a difference of 0.25%), and Immigrants from Bahamas ($39,861, a difference of 0.32%).
| Demographics | Rating | Rank | Median Earnings |
| Immigrants | Honduras | 0.0 /100 | #316 | Tragic $40,195 |
| Fijians | 0.0 /100 | #317 | Tragic $40,193 |
| Dutch West Indians | 0.0 /100 | #318 | Tragic $40,107 |
| Blacks/African Americans | 0.0 /100 | #319 | Tragic $40,085 |
| Immigrants | Bahamas | 0.0 /100 | #320 | Tragic $39,861 |
| Mexicans | 0.0 /100 | #321 | Tragic $39,834 |
| Immigrants | Central America | 0.0 /100 | #322 | Tragic $39,762 |
| Bahamians | 0.0 /100 | #323 | Tragic $39,735 |
| Ottawa | 0.0 /100 | #324 | Tragic $39,721 |
| Creek | 0.0 /100 | #325 | Tragic $39,648 |
| Immigrants | Yemen | 0.0 /100 | #326 | Tragic $39,540 |
| Yuman | 0.0 /100 | #327 | Tragic $39,523 |
| Sioux | 0.0 /100 | #328 | Tragic $39,448 |
| Kiowa | 0.0 /100 | #329 | Tragic $39,232 |
| Immigrants | Congo | 0.0 /100 | #330 | Tragic $39,169 |
Demographics Similar to Osage by Median Earnings
In terms of median earnings, the demographic groups most similar to Osage are Pennsylvania German ($42,615, a difference of 0.090%), Belizean ($42,702, a difference of 0.12%), American ($42,742, a difference of 0.21%), Cree ($42,777, a difference of 0.29%), and Iroquois ($42,430, a difference of 0.52%).
| Demographics | Rating | Rank | Median Earnings |
| Inupiat | 0.8 /100 | #263 | Tragic $43,000 |
| Immigrants | Liberia | 0.7 /100 | #264 | Tragic $42,923 |
| Salvadorans | 0.7 /100 | #265 | Tragic $42,912 |
| Immigrants | Laos | 0.7 /100 | #266 | Tragic $42,884 |
| Cree | 0.6 /100 | #267 | Tragic $42,777 |
| Americans | 0.6 /100 | #268 | Tragic $42,742 |
| Belizeans | 0.5 /100 | #269 | Tragic $42,702 |
| Osage | 0.5 /100 | #270 | Tragic $42,651 |
| Pennsylvania Germans | 0.5 /100 | #271 | Tragic $42,615 |
| Iroquois | 0.4 /100 | #272 | Tragic $42,430 |
| Immigrants | Dominica | 0.4 /100 | #273 | Tragic $42,420 |
| Immigrants | El Salvador | 0.4 /100 | #274 | Tragic $42,413 |
| Immigrants | Belize | 0.3 /100 | #275 | Tragic $42,339 |
| Spanish Americans | 0.3 /100 | #276 | Tragic $42,316 |
| Central Americans | 0.3 /100 | #277 | Tragic $42,280 |