Immigrants from North Macedonia vs Sudanese Median Earnings
COMPARE
Immigrants from North Macedonia
Sudanese
Median Earnings
Median Earnings Comparison
Immigrants from North Macedonia
Sudanese
$49,658
MEDIAN EARNINGS
98.9/ 100
METRIC RATING
97th/ 347
METRIC RANK
$44,419
MEDIAN EARNINGS
5.6/ 100
METRIC RATING
238th/ 347
METRIC RANK
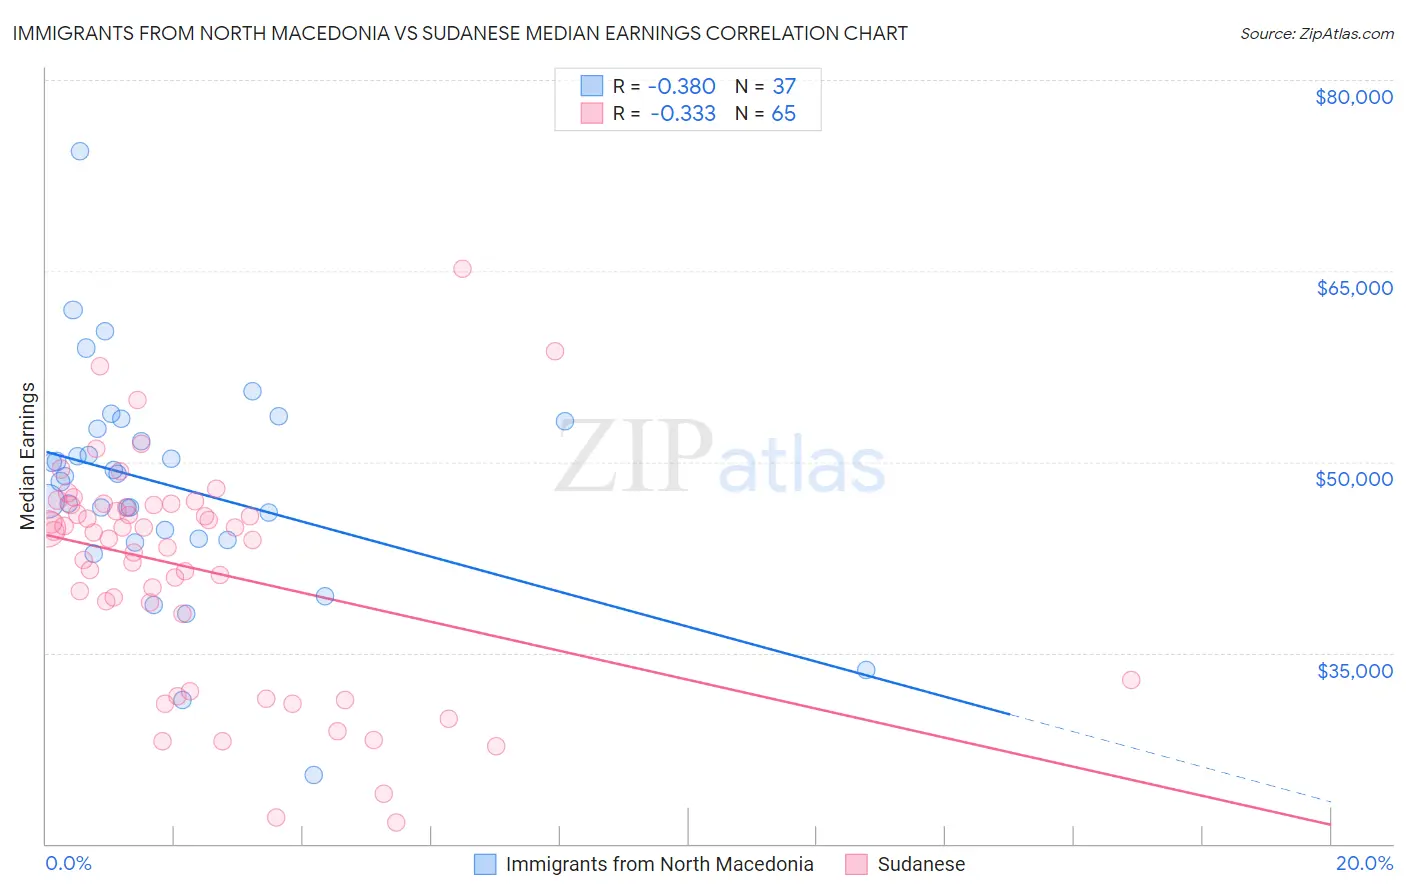
Immigrants from North Macedonia vs Sudanese Median Earnings Correlation Chart
The statistical analysis conducted on geographies consisting of 74,300,435 people shows a mild negative correlation between the proportion of Immigrants from North Macedonia and median earnings in the United States with a correlation coefficient (R) of -0.380 and weighted average of $49,658. Similarly, the statistical analysis conducted on geographies consisting of 110,129,376 people shows a mild negative correlation between the proportion of Sudanese and median earnings in the United States with a correlation coefficient (R) of -0.333 and weighted average of $44,419, a difference of 11.8%.
Median Earnings Correlation Summary
| Measurement | Immigrants from North Macedonia | Sudanese |
| Minimum | $25,438 | $21,638 |
| Maximum | $74,419 | $65,192 |
| Range | $48,981 | $43,554 |
| Mean | $48,126 | $41,590 |
| Median | $48,906 | $44,417 |
| Interquartile 25% (IQ1) | $43,904 | $35,456 |
| Interquartile 75% (IQ3) | $52,892 | $46,591 |
| Interquartile Range (IQR) | $8,988 | $11,136 |
| Standard Deviation (Sample) | $8,757 | $8,811 |
| Standard Deviation (Population) | $8,638 | $8,743 |
Similar Demographics by Median Earnings
Demographics Similar to Immigrants from North Macedonia by Median Earnings
In terms of median earnings, the demographic groups most similar to Immigrants from North Macedonia are Immigrants from Northern Africa ($49,648, a difference of 0.020%), Immigrants from Afghanistan ($49,645, a difference of 0.030%), Immigrants from Lebanon ($49,682, a difference of 0.050%), Immigrants from Poland ($49,633, a difference of 0.050%), and Jordanian ($49,632, a difference of 0.050%).
| Demographics | Rating | Rank | Median Earnings |
| Italians | 99.3 /100 | #90 | Exceptional $49,915 |
| Macedonians | 99.2 /100 | #91 | Exceptional $49,893 |
| Immigrants | Argentina | 99.2 /100 | #92 | Exceptional $49,841 |
| Armenians | 99.1 /100 | #93 | Exceptional $49,804 |
| Croatians | 99.0 /100 | #94 | Exceptional $49,724 |
| Immigrants | England | 99.0 /100 | #95 | Exceptional $49,722 |
| Immigrants | Lebanon | 99.0 /100 | #96 | Exceptional $49,682 |
| Immigrants | North Macedonia | 98.9 /100 | #97 | Exceptional $49,658 |
| Immigrants | Northern Africa | 98.9 /100 | #98 | Exceptional $49,648 |
| Immigrants | Afghanistan | 98.9 /100 | #99 | Exceptional $49,645 |
| Immigrants | Poland | 98.9 /100 | #100 | Exceptional $49,633 |
| Jordanians | 98.9 /100 | #101 | Exceptional $49,632 |
| Ethiopians | 98.8 /100 | #102 | Exceptional $49,572 |
| Austrians | 98.7 /100 | #103 | Exceptional $49,501 |
| Immigrants | Brazil | 98.6 /100 | #104 | Exceptional $49,463 |
Demographics Similar to Sudanese by Median Earnings
In terms of median earnings, the demographic groups most similar to Sudanese are Immigrants from Ecuador ($44,462, a difference of 0.10%), Senegalese ($44,373, a difference of 0.10%), British West Indian ($44,552, a difference of 0.30%), Venezuelan ($44,580, a difference of 0.36%), and Aleut ($44,241, a difference of 0.40%).
| Demographics | Rating | Rank | Median Earnings |
| Japanese | 9.5 /100 | #231 | Tragic $44,825 |
| Delaware | 9.0 /100 | #232 | Tragic $44,783 |
| Immigrants | Sudan | 8.8 /100 | #233 | Tragic $44,767 |
| Cape Verdeans | 7.5 /100 | #234 | Tragic $44,640 |
| Venezuelans | 6.9 /100 | #235 | Tragic $44,580 |
| British West Indians | 6.7 /100 | #236 | Tragic $44,552 |
| Immigrants | Ecuador | 5.9 /100 | #237 | Tragic $44,462 |
| Sudanese | 5.6 /100 | #238 | Tragic $44,419 |
| Senegalese | 5.3 /100 | #239 | Tragic $44,373 |
| Aleuts | 4.4 /100 | #240 | Tragic $44,241 |
| Samoans | 4.2 /100 | #241 | Tragic $44,206 |
| Immigrants | Venezuela | 4.0 /100 | #242 | Tragic $44,163 |
| Sub-Saharan Africans | 3.7 /100 | #243 | Tragic $44,118 |
| Immigrants | Nonimmigrants | 3.7 /100 | #244 | Tragic $44,117 |
| Immigrants | Burma/Myanmar | 3.2 /100 | #245 | Tragic $43,998 |