Bahamian vs Immigrants from Scotland Median Earnings
COMPARE
Bahamian
Immigrants from Scotland
Median Earnings
Median Earnings Comparison
Bahamians
Immigrants from Scotland
$39,735
MEDIAN EARNINGS
0.0/ 100
METRIC RATING
323rd/ 347
METRIC RANK
$50,741
MEDIAN EARNINGS
99.8/ 100
METRIC RATING
75th/ 347
METRIC RANK
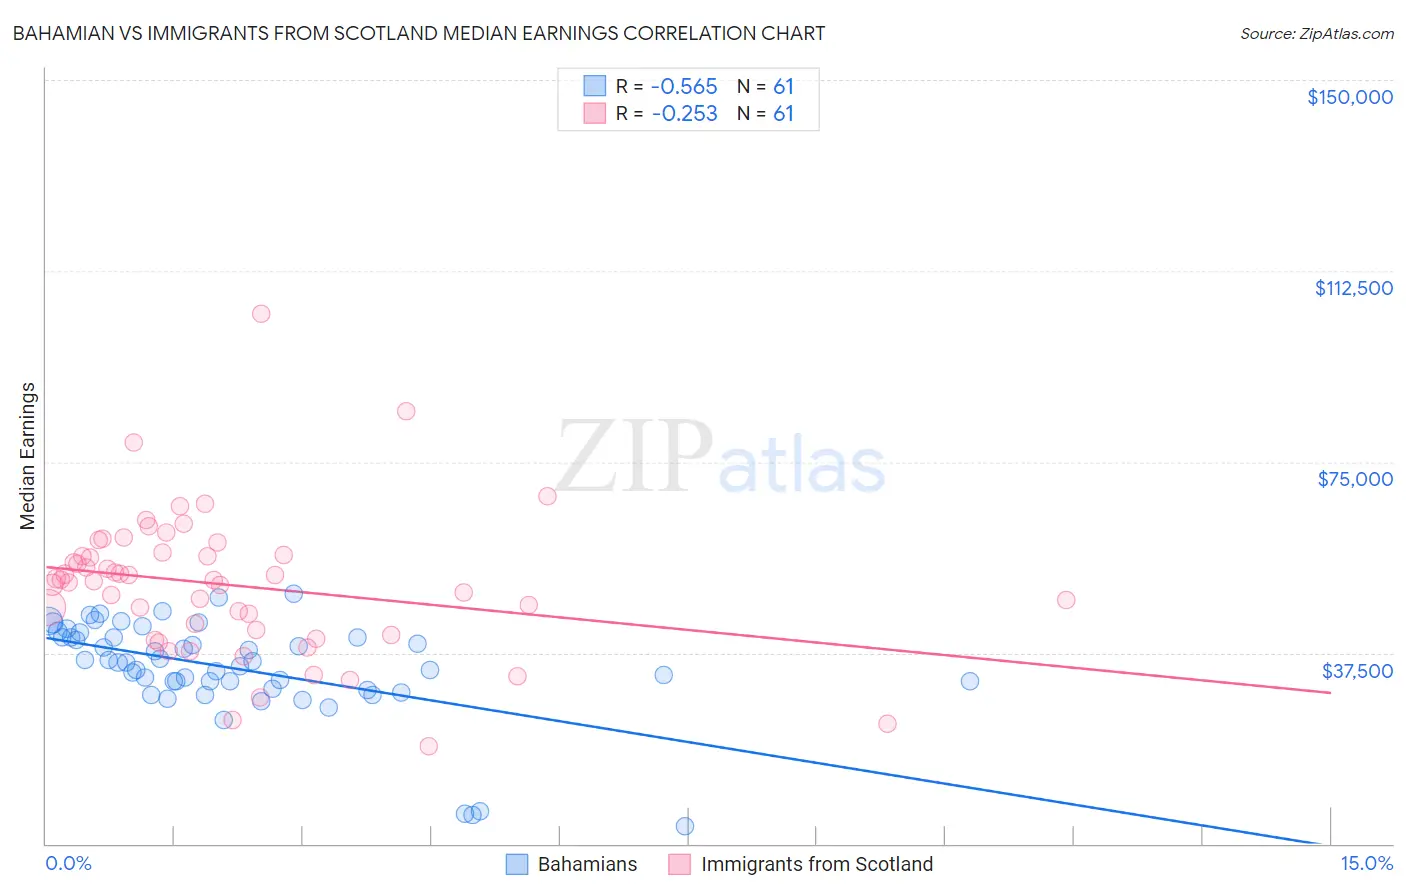
Bahamian vs Immigrants from Scotland Median Earnings Correlation Chart
The statistical analysis conducted on geographies consisting of 112,703,764 people shows a substantial negative correlation between the proportion of Bahamians and median earnings in the United States with a correlation coefficient (R) of -0.565 and weighted average of $39,735. Similarly, the statistical analysis conducted on geographies consisting of 196,389,390 people shows a weak negative correlation between the proportion of Immigrants from Scotland and median earnings in the United States with a correlation coefficient (R) of -0.253 and weighted average of $50,741, a difference of 27.7%.
Median Earnings Correlation Summary
| Measurement | Bahamian | Immigrants from Scotland |
| Minimum | $3,467 | $19,118 |
| Maximum | $49,150 | $104,015 |
| Range | $45,683 | $84,897 |
| Mean | $34,478 | $50,819 |
| Median | $35,694 | $51,683 |
| Interquartile 25% (IQ1) | $31,085 | $41,420 |
| Interquartile 75% (IQ3) | $40,552 | $56,954 |
| Interquartile Range (IQR) | $9,467 | $15,534 |
| Standard Deviation (Sample) | $9,647 | $14,157 |
| Standard Deviation (Population) | $9,567 | $14,040 |
Similar Demographics by Median Earnings
Demographics Similar to Bahamians by Median Earnings
In terms of median earnings, the demographic groups most similar to Bahamians are Ottawa ($39,721, a difference of 0.040%), Immigrants from Central America ($39,762, a difference of 0.070%), Creek ($39,648, a difference of 0.22%), Mexican ($39,834, a difference of 0.25%), and Immigrants from Bahamas ($39,861, a difference of 0.32%).
| Demographics | Rating | Rank | Median Earnings |
| Immigrants | Honduras | 0.0 /100 | #316 | Tragic $40,195 |
| Fijians | 0.0 /100 | #317 | Tragic $40,193 |
| Dutch West Indians | 0.0 /100 | #318 | Tragic $40,107 |
| Blacks/African Americans | 0.0 /100 | #319 | Tragic $40,085 |
| Immigrants | Bahamas | 0.0 /100 | #320 | Tragic $39,861 |
| Mexicans | 0.0 /100 | #321 | Tragic $39,834 |
| Immigrants | Central America | 0.0 /100 | #322 | Tragic $39,762 |
| Bahamians | 0.0 /100 | #323 | Tragic $39,735 |
| Ottawa | 0.0 /100 | #324 | Tragic $39,721 |
| Creek | 0.0 /100 | #325 | Tragic $39,648 |
| Immigrants | Yemen | 0.0 /100 | #326 | Tragic $39,540 |
| Yuman | 0.0 /100 | #327 | Tragic $39,523 |
| Sioux | 0.0 /100 | #328 | Tragic $39,448 |
| Kiowa | 0.0 /100 | #329 | Tragic $39,232 |
| Immigrants | Congo | 0.0 /100 | #330 | Tragic $39,169 |
Demographics Similar to Immigrants from Scotland by Median Earnings
In terms of median earnings, the demographic groups most similar to Immigrants from Scotland are South African ($50,752, a difference of 0.020%), Immigrants from Netherlands ($50,818, a difference of 0.15%), Immigrants from Egypt ($50,901, a difference of 0.32%), Immigrants from Italy ($50,581, a difference of 0.32%), and Immigrants from Western Europe ($50,549, a difference of 0.38%).
| Demographics | Rating | Rank | Median Earnings |
| Paraguayans | 99.9 /100 | #68 | Exceptional $51,068 |
| Mongolians | 99.8 /100 | #69 | Exceptional $51,038 |
| Lithuanians | 99.8 /100 | #70 | Exceptional $50,991 |
| Immigrants | Ukraine | 99.8 /100 | #71 | Exceptional $50,984 |
| Immigrants | Egypt | 99.8 /100 | #72 | Exceptional $50,901 |
| Immigrants | Netherlands | 99.8 /100 | #73 | Exceptional $50,818 |
| South Africans | 99.8 /100 | #74 | Exceptional $50,752 |
| Immigrants | Scotland | 99.8 /100 | #75 | Exceptional $50,741 |
| Immigrants | Italy | 99.7 /100 | #76 | Exceptional $50,581 |
| Immigrants | Western Europe | 99.7 /100 | #77 | Exceptional $50,549 |
| Argentineans | 99.6 /100 | #78 | Exceptional $50,399 |
| Laotians | 99.6 /100 | #79 | Exceptional $50,343 |
| Ukrainians | 99.6 /100 | #80 | Exceptional $50,320 |
| Immigrants | Southern Europe | 99.6 /100 | #81 | Exceptional $50,280 |
| Immigrants | Moldova | 99.5 /100 | #82 | Exceptional $50,274 |