Bahamian vs Sudanese 9th Grade
COMPARE
Bahamian
Sudanese
9th Grade
9th Grade Comparison
Bahamians
Sudanese
94.4%
9TH GRADE
7.0/ 100
METRIC RATING
223rd/ 347
METRIC RANK
94.7%
9TH GRADE
32.7/ 100
METRIC RATING
190th/ 347
METRIC RANK
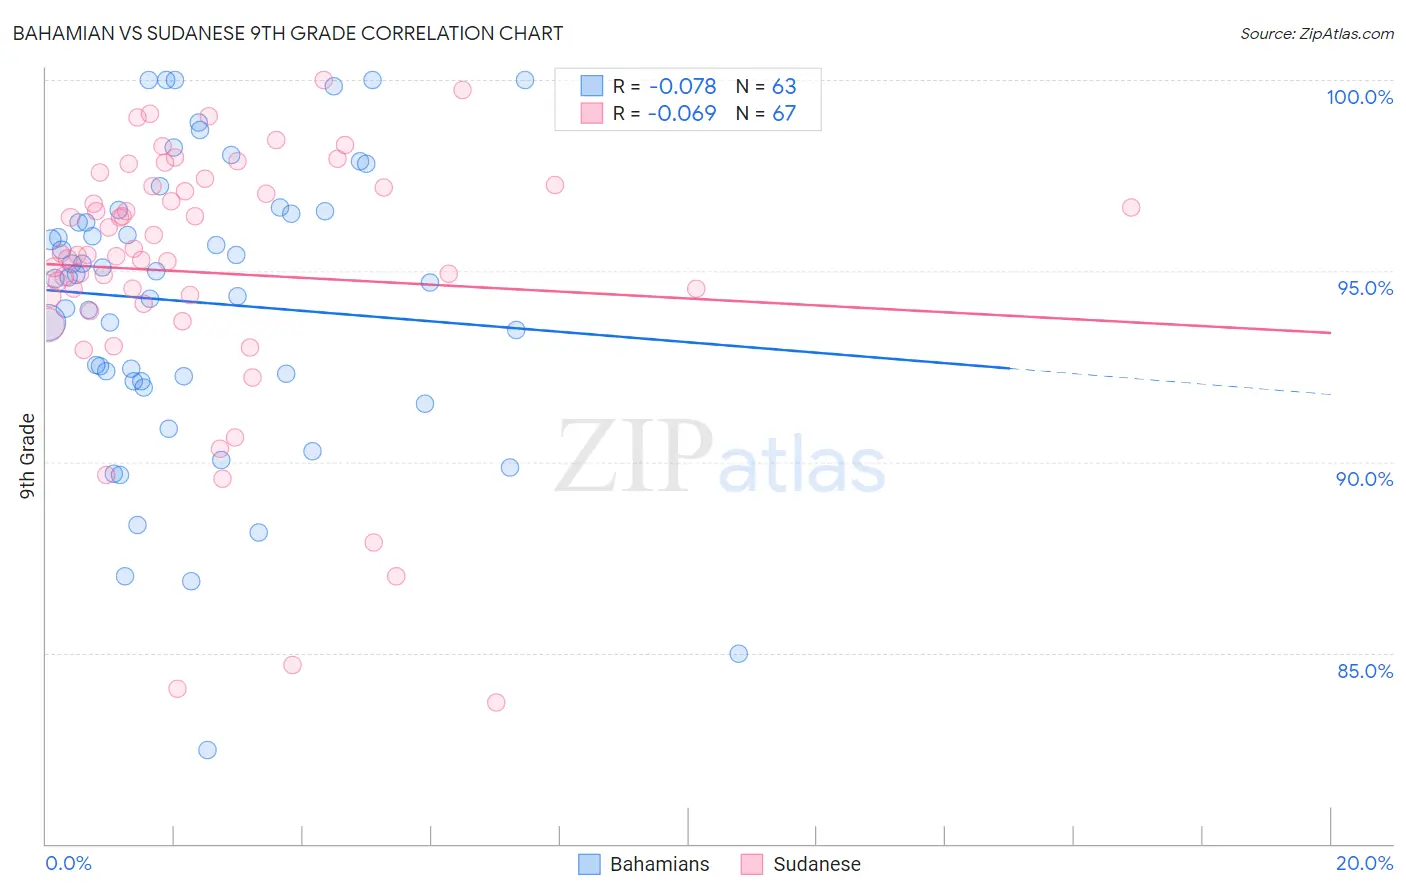
Bahamian vs Sudanese 9th Grade Correlation Chart
The statistical analysis conducted on geographies consisting of 112,698,819 people shows a slight negative correlation between the proportion of Bahamians and percentage of population with at least 9th grade education in the United States with a correlation coefficient (R) of -0.078 and weighted average of 94.4%. Similarly, the statistical analysis conducted on geographies consisting of 110,134,719 people shows a slight negative correlation between the proportion of Sudanese and percentage of population with at least 9th grade education in the United States with a correlation coefficient (R) of -0.069 and weighted average of 94.7%, a difference of 0.34%.
9th Grade Correlation Summary
| Measurement | Bahamian | Sudanese |
| Minimum | 82.5% | 83.7% |
| Maximum | 100.0% | 100.0% |
| Range | 17.5% | 16.3% |
| Mean | 94.2% | 95.0% |
| Median | 94.8% | 95.4% |
| Interquartile 25% (IQ1) | 92.1% | 94.1% |
| Interquartile 75% (IQ3) | 96.6% | 97.2% |
| Interquartile Range (IQR) | 4.4% | 3.1% |
| Standard Deviation (Sample) | 3.8% | 3.5% |
| Standard Deviation (Population) | 3.8% | 3.5% |
Similar Demographics by 9th Grade
Demographics Similar to Bahamians by 9th Grade
In terms of 9th grade, the demographic groups most similar to Bahamians are Immigrants from Asia (94.4%, a difference of 0.020%), Immigrants from Eastern Africa (94.5%, a difference of 0.030%), Tongan (94.4%, a difference of 0.030%), Indian (Asian) (94.5%, a difference of 0.040%), and Portuguese (94.5%, a difference of 0.050%).
| Demographics | Rating | Rank | 9th Grade |
| Immigrants | Western Asia | 10.7 /100 | #216 | Poor 94.5% |
| Asians | 9.9 /100 | #217 | Tragic 94.5% |
| Portuguese | 9.2 /100 | #218 | Tragic 94.5% |
| Africans | 9.0 /100 | #219 | Tragic 94.5% |
| Indians (Asian) | 8.6 /100 | #220 | Tragic 94.5% |
| Immigrants | Eastern Africa | 8.2 /100 | #221 | Tragic 94.5% |
| Immigrants | Asia | 7.7 /100 | #222 | Tragic 94.4% |
| Bahamians | 7.0 /100 | #223 | Tragic 94.4% |
| Tongans | 6.0 /100 | #224 | Tragic 94.4% |
| Ethiopians | 5.4 /100 | #225 | Tragic 94.4% |
| Sub-Saharan Africans | 5.4 /100 | #226 | Tragic 94.4% |
| Immigrants | Sierra Leone | 4.8 /100 | #227 | Tragic 94.4% |
| Lumbee | 4.7 /100 | #228 | Tragic 94.4% |
| Immigrants | Southern Europe | 4.5 /100 | #229 | Tragic 94.3% |
| Apache | 4.2 /100 | #230 | Tragic 94.3% |
Demographics Similar to Sudanese by 9th Grade
In terms of 9th grade, the demographic groups most similar to Sudanese are Immigrants from Argentina (94.8%, a difference of 0.010%), Assyrian/Chaldean/Syriac (94.7%, a difference of 0.010%), Guamanian/Chamorro (94.8%, a difference of 0.020%), Immigrants from Albania (94.8%, a difference of 0.020%), and Immigrants from Northern Africa (94.7%, a difference of 0.020%).
| Demographics | Rating | Rank | 9th Grade |
| Immigrants | Nepal | 39.7 /100 | #183 | Fair 94.8% |
| Argentineans | 37.6 /100 | #184 | Fair 94.8% |
| Liberians | 37.4 /100 | #185 | Fair 94.8% |
| Hopi | 37.1 /100 | #186 | Fair 94.8% |
| Guamanians/Chamorros | 35.5 /100 | #187 | Fair 94.8% |
| Immigrants | Albania | 34.5 /100 | #188 | Fair 94.8% |
| Immigrants | Argentina | 34.4 /100 | #189 | Fair 94.8% |
| Sudanese | 32.7 /100 | #190 | Fair 94.7% |
| Assyrians/Chaldeans/Syriacs | 32.0 /100 | #191 | Fair 94.7% |
| Immigrants | Northern Africa | 30.7 /100 | #192 | Fair 94.7% |
| Paraguayans | 30.1 /100 | #193 | Fair 94.7% |
| Panamanians | 29.0 /100 | #194 | Fair 94.7% |
| Marshallese | 27.9 /100 | #195 | Fair 94.7% |
| Immigrants | Lebanon | 27.2 /100 | #196 | Fair 94.7% |
| Immigrants | Micronesia | 24.7 /100 | #197 | Fair 94.7% |