Bahamian vs Sudanese Single Father Households
COMPARE
Bahamian
Sudanese
Single Father Households
Single Father Households Comparison
Bahamians
Sudanese
2.5%
SINGLE FATHER HOUSEHOLDS
2.4/ 100
METRIC RATING
248th/ 347
METRIC RANK
2.4%
SINGLE FATHER HOUSEHOLDS
13.0/ 100
METRIC RATING
219th/ 347
METRIC RANK
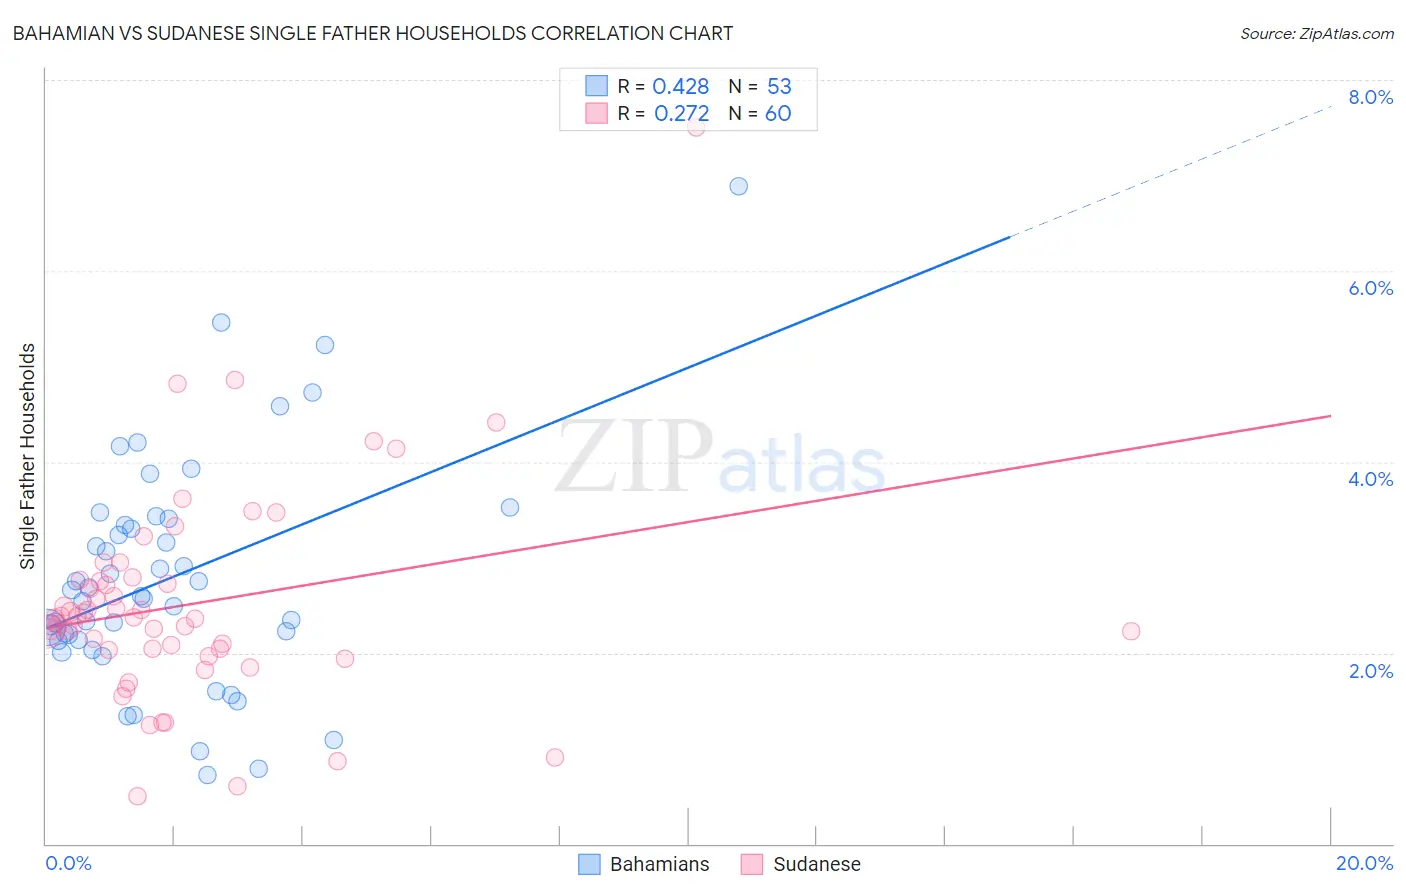
Bahamian vs Sudanese Single Father Households Correlation Chart
The statistical analysis conducted on geographies consisting of 112,214,100 people shows a moderate positive correlation between the proportion of Bahamians and percentage of single father households in the United States with a correlation coefficient (R) of 0.428 and weighted average of 2.5%. Similarly, the statistical analysis conducted on geographies consisting of 109,938,737 people shows a weak positive correlation between the proportion of Sudanese and percentage of single father households in the United States with a correlation coefficient (R) of 0.272 and weighted average of 2.4%, a difference of 3.2%.
Single Father Households Correlation Summary
| Measurement | Bahamian | Sudanese |
| Minimum | 0.72% | 0.49% |
| Maximum | 6.9% | 7.5% |
| Range | 6.2% | 7.0% |
| Mean | 2.8% | 2.5% |
| Median | 2.6% | 2.4% |
| Interquartile 25% (IQ1) | 2.1% | 2.0% |
| Interquartile 75% (IQ3) | 3.4% | 2.8% |
| Interquartile Range (IQR) | 1.2% | 0.73% |
| Standard Deviation (Sample) | 1.2% | 1.1% |
| Standard Deviation (Population) | 1.2% | 1.1% |
Similar Demographics by Single Father Households
Demographics Similar to Bahamians by Single Father Households
In terms of single father households, the demographic groups most similar to Bahamians are Delaware (2.5%, a difference of 0.040%), Native Hawaiian (2.5%, a difference of 0.060%), Basque (2.5%, a difference of 0.080%), Immigrants from Cameroon (2.5%, a difference of 0.090%), and Somali (2.5%, a difference of 0.25%).
| Demographics | Rating | Rank | Single Father Households |
| Portuguese | 4.1 /100 | #241 | Tragic 2.5% |
| Osage | 4.1 /100 | #242 | Tragic 2.5% |
| Spaniards | 3.1 /100 | #243 | Tragic 2.5% |
| Immigrants | Middle Africa | 2.8 /100 | #244 | Tragic 2.5% |
| Basques | 2.5 /100 | #245 | Tragic 2.5% |
| Native Hawaiians | 2.5 /100 | #246 | Tragic 2.5% |
| Delaware | 2.5 /100 | #247 | Tragic 2.5% |
| Bahamians | 2.4 /100 | #248 | Tragic 2.5% |
| Immigrants | Cameroon | 2.3 /100 | #249 | Tragic 2.5% |
| Somalis | 2.1 /100 | #250 | Tragic 2.5% |
| Liberians | 2.0 /100 | #251 | Tragic 2.5% |
| Immigrants | Eritrea | 2.0 /100 | #252 | Tragic 2.5% |
| Immigrants | Somalia | 1.9 /100 | #253 | Tragic 2.5% |
| Immigrants | Thailand | 1.8 /100 | #254 | Tragic 2.5% |
| Tongans | 1.5 /100 | #255 | Tragic 2.5% |
Demographics Similar to Sudanese by Single Father Households
In terms of single father households, the demographic groups most similar to Sudanese are Ghanaian (2.4%, a difference of 0.010%), Immigrants from Ethiopia (2.4%, a difference of 0.070%), Immigrants from Burma/Myanmar (2.4%, a difference of 0.14%), Immigrants from Eastern Africa (2.4%, a difference of 0.17%), and Dutch (2.4%, a difference of 0.20%).
| Demographics | Rating | Rank | Single Father Households |
| Finns | 18.3 /100 | #212 | Poor 2.4% |
| Norwegians | 17.1 /100 | #213 | Poor 2.4% |
| Ethiopians | 16.6 /100 | #214 | Poor 2.4% |
| Immigrants | South Eastern Asia | 15.9 /100 | #215 | Poor 2.4% |
| Immigrants | Ecuador | 14.9 /100 | #216 | Poor 2.4% |
| Dutch | 14.3 /100 | #217 | Poor 2.4% |
| Immigrants | Ethiopia | 13.4 /100 | #218 | Poor 2.4% |
| Sudanese | 13.0 /100 | #219 | Poor 2.4% |
| Ghanaians | 12.9 /100 | #220 | Poor 2.4% |
| Immigrants | Burma/Myanmar | 12.1 /100 | #221 | Poor 2.4% |
| Immigrants | Eastern Africa | 11.9 /100 | #222 | Poor 2.4% |
| Immigrants | Uruguay | 11.0 /100 | #223 | Poor 2.4% |
| Immigrants | Bahamas | 10.6 /100 | #224 | Poor 2.4% |
| Marshallese | 9.7 /100 | #225 | Tragic 2.4% |
| Blacks/African Americans | 9.7 /100 | #226 | Tragic 2.4% |