Laotian vs Sudanese Median Earnings
COMPARE
Laotian
Sudanese
Median Earnings
Median Earnings Comparison
Laotians
Sudanese
$50,343
MEDIAN EARNINGS
99.6/ 100
METRIC RATING
79th/ 347
METRIC RANK
$44,419
MEDIAN EARNINGS
5.6/ 100
METRIC RATING
238th/ 347
METRIC RANK
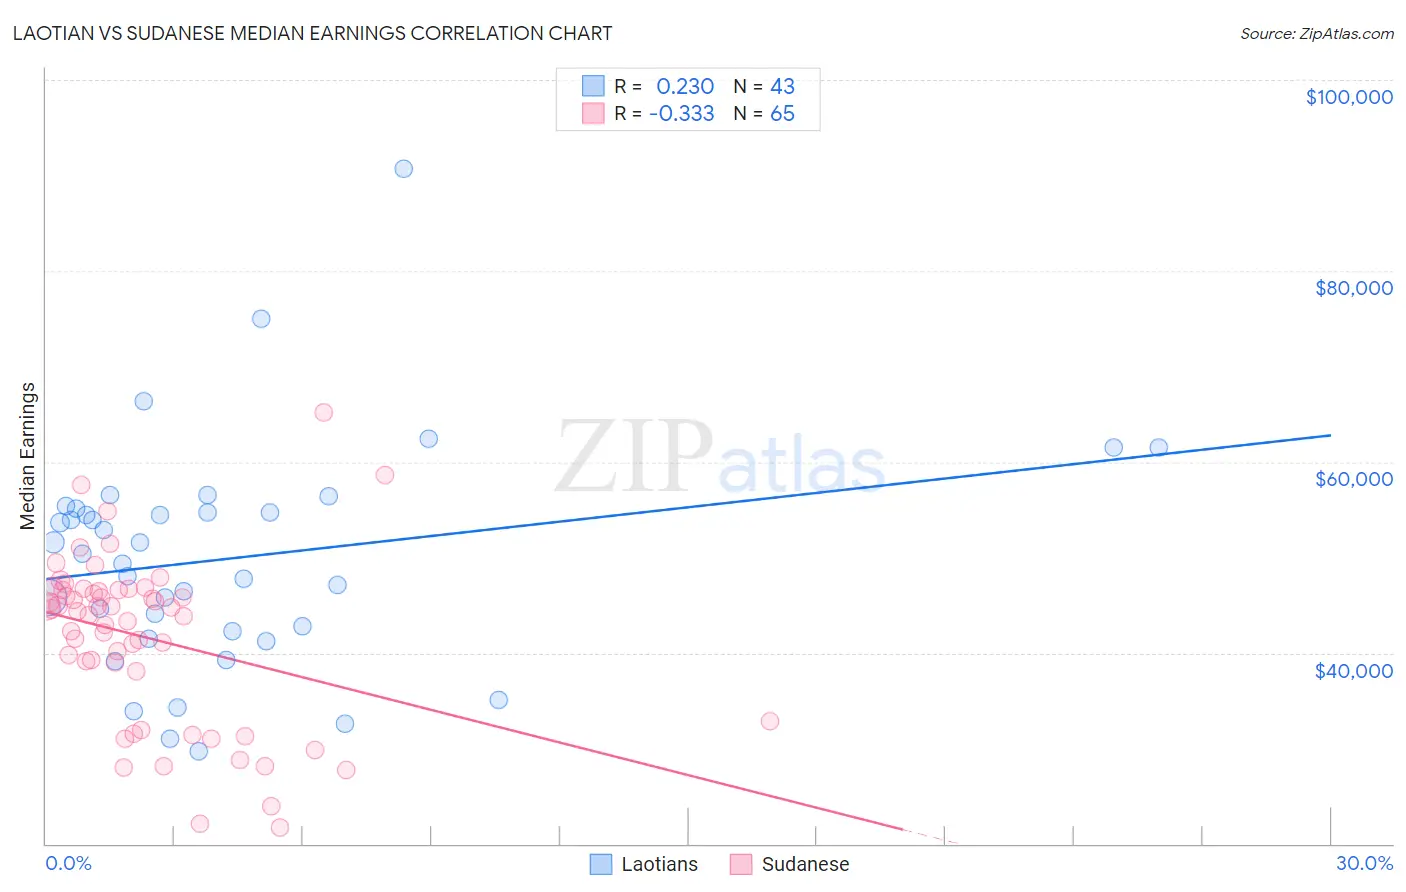
Laotian vs Sudanese Median Earnings Correlation Chart
The statistical analysis conducted on geographies consisting of 224,848,117 people shows a weak positive correlation between the proportion of Laotians and median earnings in the United States with a correlation coefficient (R) of 0.230 and weighted average of $50,343. Similarly, the statistical analysis conducted on geographies consisting of 110,129,376 people shows a mild negative correlation between the proportion of Sudanese and median earnings in the United States with a correlation coefficient (R) of -0.333 and weighted average of $44,419, a difference of 13.3%.
Median Earnings Correlation Summary
| Measurement | Laotian | Sudanese |
| Minimum | $29,751 | $21,638 |
| Maximum | $90,729 | $65,192 |
| Range | $60,978 | $43,554 |
| Mean | $49,880 | $41,590 |
| Median | $50,359 | $44,417 |
| Interquartile 25% (IQ1) | $42,206 | $35,456 |
| Interquartile 75% (IQ3) | $55,106 | $46,591 |
| Interquartile Range (IQR) | $12,900 | $11,136 |
| Standard Deviation (Sample) | $11,670 | $8,811 |
| Standard Deviation (Population) | $11,533 | $8,743 |
Similar Demographics by Median Earnings
Demographics Similar to Laotians by Median Earnings
In terms of median earnings, the demographic groups most similar to Laotians are Ukrainian ($50,320, a difference of 0.050%), Argentinean ($50,399, a difference of 0.11%), Immigrants from Southern Europe ($50,280, a difference of 0.12%), Immigrants from Moldova ($50,274, a difference of 0.14%), and Romanian ($50,244, a difference of 0.20%).
| Demographics | Rating | Rank | Median Earnings |
| Immigrants | Egypt | 99.8 /100 | #72 | Exceptional $50,901 |
| Immigrants | Netherlands | 99.8 /100 | #73 | Exceptional $50,818 |
| South Africans | 99.8 /100 | #74 | Exceptional $50,752 |
| Immigrants | Scotland | 99.8 /100 | #75 | Exceptional $50,741 |
| Immigrants | Italy | 99.7 /100 | #76 | Exceptional $50,581 |
| Immigrants | Western Europe | 99.7 /100 | #77 | Exceptional $50,549 |
| Argentineans | 99.6 /100 | #78 | Exceptional $50,399 |
| Laotians | 99.6 /100 | #79 | Exceptional $50,343 |
| Ukrainians | 99.6 /100 | #80 | Exceptional $50,320 |
| Immigrants | Southern Europe | 99.6 /100 | #81 | Exceptional $50,280 |
| Immigrants | Moldova | 99.5 /100 | #82 | Exceptional $50,274 |
| Romanians | 99.5 /100 | #83 | Exceptional $50,244 |
| Immigrants | Hungary | 99.5 /100 | #84 | Exceptional $50,227 |
| Immigrants | Kazakhstan | 99.5 /100 | #85 | Exceptional $50,225 |
| Immigrants | Canada | 99.5 /100 | #86 | Exceptional $50,192 |
Demographics Similar to Sudanese by Median Earnings
In terms of median earnings, the demographic groups most similar to Sudanese are Immigrants from Ecuador ($44,462, a difference of 0.10%), Senegalese ($44,373, a difference of 0.10%), British West Indian ($44,552, a difference of 0.30%), Venezuelan ($44,580, a difference of 0.36%), and Aleut ($44,241, a difference of 0.40%).
| Demographics | Rating | Rank | Median Earnings |
| Japanese | 9.5 /100 | #231 | Tragic $44,825 |
| Delaware | 9.0 /100 | #232 | Tragic $44,783 |
| Immigrants | Sudan | 8.8 /100 | #233 | Tragic $44,767 |
| Cape Verdeans | 7.5 /100 | #234 | Tragic $44,640 |
| Venezuelans | 6.9 /100 | #235 | Tragic $44,580 |
| British West Indians | 6.7 /100 | #236 | Tragic $44,552 |
| Immigrants | Ecuador | 5.9 /100 | #237 | Tragic $44,462 |
| Sudanese | 5.6 /100 | #238 | Tragic $44,419 |
| Senegalese | 5.3 /100 | #239 | Tragic $44,373 |
| Aleuts | 4.4 /100 | #240 | Tragic $44,241 |
| Samoans | 4.2 /100 | #241 | Tragic $44,206 |
| Immigrants | Venezuela | 4.0 /100 | #242 | Tragic $44,163 |
| Sub-Saharan Africans | 3.7 /100 | #243 | Tragic $44,118 |
| Immigrants | Nonimmigrants | 3.7 /100 | #244 | Tragic $44,117 |
| Immigrants | Burma/Myanmar | 3.2 /100 | #245 | Tragic $43,998 |