West Indian vs Sudanese Median Earnings
COMPARE
West Indian
Sudanese
Median Earnings
Median Earnings Comparison
West Indians
Sudanese
$45,132
MEDIAN EARNINGS
13.9/ 100
METRIC RATING
224th/ 347
METRIC RANK
$44,419
MEDIAN EARNINGS
5.6/ 100
METRIC RATING
238th/ 347
METRIC RANK
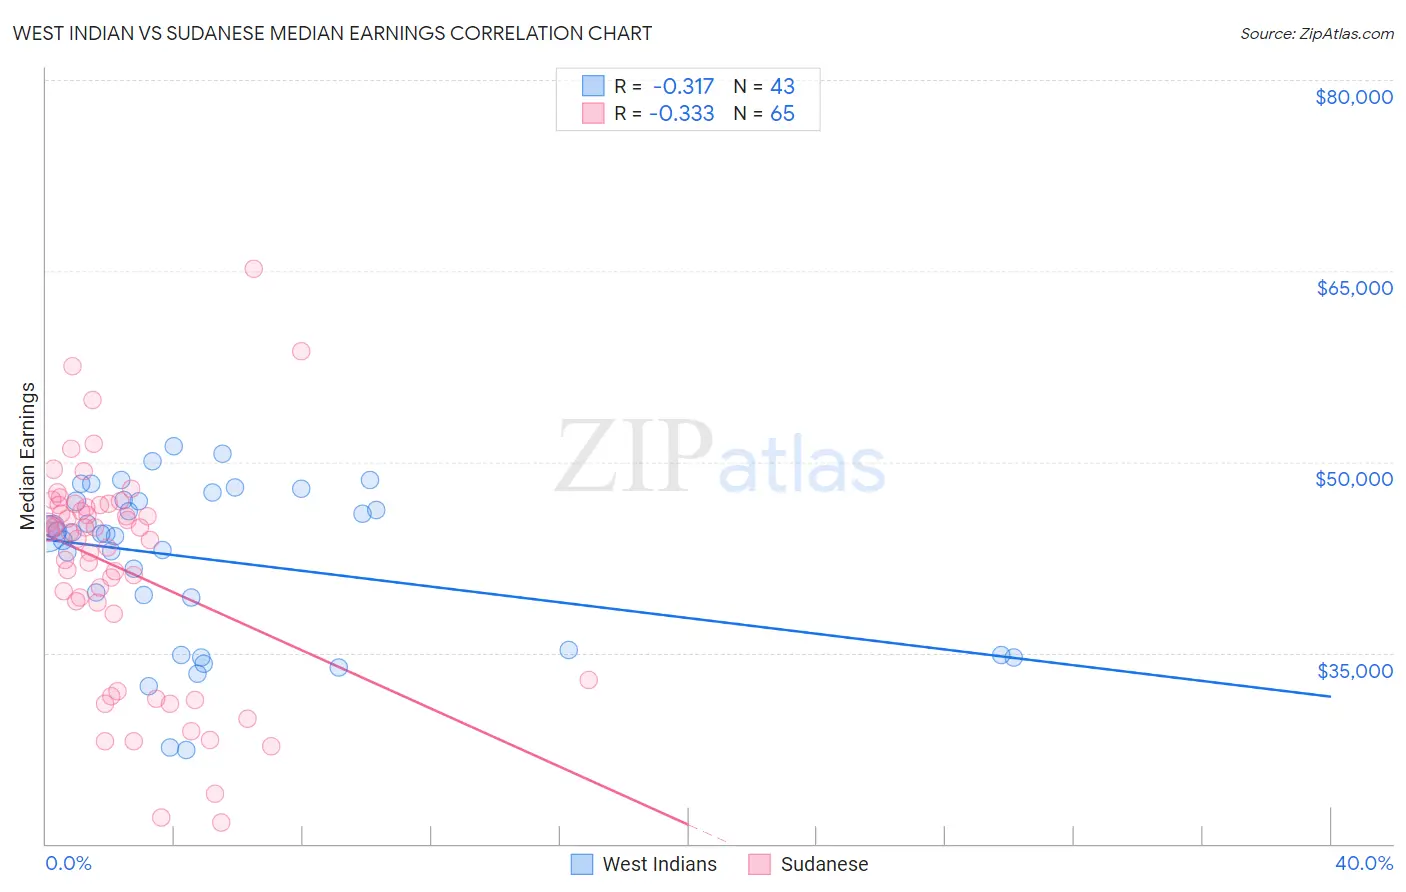
West Indian vs Sudanese Median Earnings Correlation Chart
The statistical analysis conducted on geographies consisting of 254,045,468 people shows a mild negative correlation between the proportion of West Indians and median earnings in the United States with a correlation coefficient (R) of -0.317 and weighted average of $45,132. Similarly, the statistical analysis conducted on geographies consisting of 110,129,376 people shows a mild negative correlation between the proportion of Sudanese and median earnings in the United States with a correlation coefficient (R) of -0.333 and weighted average of $44,419, a difference of 1.6%.
Median Earnings Correlation Summary
| Measurement | West Indian | Sudanese |
| Minimum | $27,409 | $21,638 |
| Maximum | $51,215 | $65,192 |
| Range | $23,806 | $43,554 |
| Mean | $42,337 | $41,590 |
| Median | $44,343 | $44,417 |
| Interquartile 25% (IQ1) | $35,256 | $35,456 |
| Interquartile 75% (IQ3) | $47,046 | $46,591 |
| Interquartile Range (IQR) | $11,790 | $11,136 |
| Standard Deviation (Sample) | $6,289 | $8,811 |
| Standard Deviation (Population) | $6,215 | $8,743 |
Demographics Similar to West Indians and Sudanese by Median Earnings
In terms of median earnings, the demographic groups most similar to West Indians are Immigrants from Cambodia ($45,090, a difference of 0.090%), Immigrants from Panama ($45,198, a difference of 0.15%), White/Caucasian ($45,197, a difference of 0.15%), Immigrants from Guyana ($45,204, a difference of 0.16%), and Immigrants from Nigeria ($45,030, a difference of 0.23%). Similarly, the demographic groups most similar to Sudanese are Immigrants from Ecuador ($44,462, a difference of 0.10%), Senegalese ($44,373, a difference of 0.10%), British West Indian ($44,552, a difference of 0.30%), Venezuelan ($44,580, a difference of 0.36%), and Aleut ($44,241, a difference of 0.40%).
| Demographics | Rating | Rank | Median Earnings |
| Immigrants | Guyana | 15.1 /100 | #221 | Poor $45,204 |
| Immigrants | Panama | 15.0 /100 | #222 | Poor $45,198 |
| Whites/Caucasians | 15.0 /100 | #223 | Poor $45,197 |
| West Indians | 13.9 /100 | #224 | Poor $45,132 |
| Immigrants | Cambodia | 13.2 /100 | #225 | Poor $45,090 |
| Immigrants | Nigeria | 12.2 /100 | #226 | Poor $45,030 |
| Native Hawaiians | 12.2 /100 | #227 | Poor $45,027 |
| Immigrants | Iraq | 11.6 /100 | #228 | Poor $44,988 |
| Scotch-Irish | 10.7 /100 | #229 | Poor $44,924 |
| Immigrants | Western Africa | 10.3 /100 | #230 | Poor $44,893 |
| Japanese | 9.5 /100 | #231 | Tragic $44,825 |
| Delaware | 9.0 /100 | #232 | Tragic $44,783 |
| Immigrants | Sudan | 8.8 /100 | #233 | Tragic $44,767 |
| Cape Verdeans | 7.5 /100 | #234 | Tragic $44,640 |
| Venezuelans | 6.9 /100 | #235 | Tragic $44,580 |
| British West Indians | 6.7 /100 | #236 | Tragic $44,552 |
| Immigrants | Ecuador | 5.9 /100 | #237 | Tragic $44,462 |
| Sudanese | 5.6 /100 | #238 | Tragic $44,419 |
| Senegalese | 5.3 /100 | #239 | Tragic $44,373 |
| Aleuts | 4.4 /100 | #240 | Tragic $44,241 |
| Samoans | 4.2 /100 | #241 | Tragic $44,206 |