Austrian vs Jordanian Median Earnings
COMPARE
Austrian
Jordanian
Median Earnings
Median Earnings Comparison
Austrians
Jordanians
$49,501
MEDIAN EARNINGS
98.7/ 100
METRIC RATING
103rd/ 347
METRIC RANK
$49,632
MEDIAN EARNINGS
98.9/ 100
METRIC RATING
101st/ 347
METRIC RANK
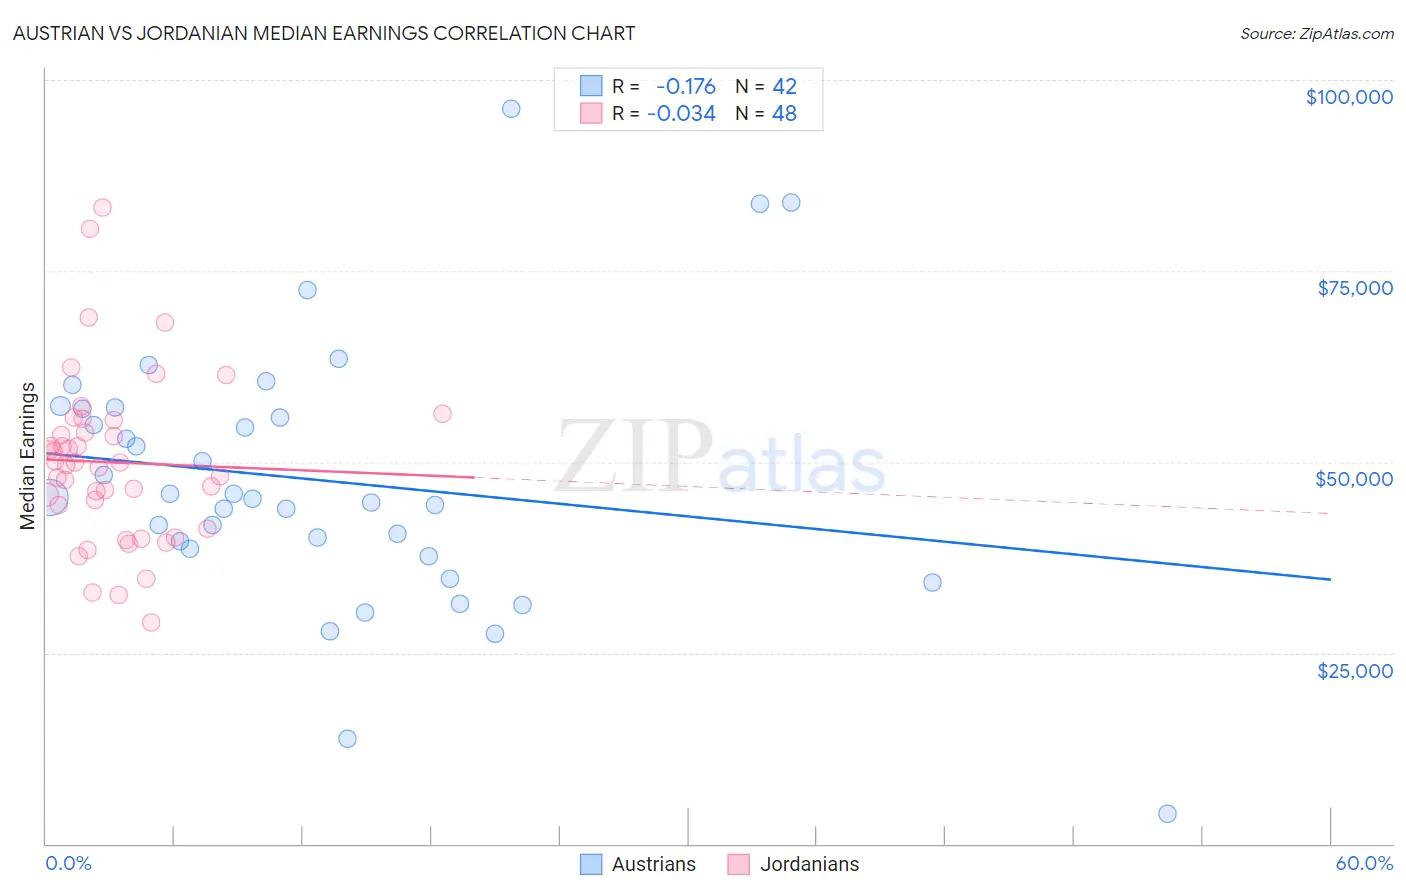
Austrian vs Jordanian Median Earnings Correlation Chart
The statistical analysis conducted on geographies consisting of 452,042,983 people shows a poor negative correlation between the proportion of Austrians and median earnings in the United States with a correlation coefficient (R) of -0.176 and weighted average of $49,501. Similarly, the statistical analysis conducted on geographies consisting of 166,400,944 people shows no correlation between the proportion of Jordanians and median earnings in the United States with a correlation coefficient (R) of -0.034 and weighted average of $49,632, a difference of 0.27%.
Median Earnings Correlation Summary
| Measurement | Austrian | Jordanian |
| Minimum | $3,902 | $29,018 |
| Maximum | $96,250 | $83,283 |
| Range | $92,348 | $54,265 |
| Mean | $47,542 | $49,942 |
| Median | $45,255 | $49,819 |
| Interquartile 25% (IQ1) | $38,609 | $42,798 |
| Interquartile 75% (IQ3) | $56,967 | $54,622 |
| Interquartile Range (IQR) | $18,358 | $11,824 |
| Standard Deviation (Sample) | $17,409 | $11,002 |
| Standard Deviation (Population) | $17,200 | $10,887 |
Demographics Similar to Austrians and Jordanians by Median Earnings
In terms of median earnings, the demographic groups most similar to Austrians are Immigrants from Brazil ($49,463, a difference of 0.080%), Ethiopian ($49,572, a difference of 0.14%), Immigrants from Western Asia ($49,389, a difference of 0.23%), Immigrants from Albania ($49,377, a difference of 0.25%), and Immigrants from Poland ($49,633, a difference of 0.27%). Similarly, the demographic groups most similar to Jordanians are Immigrants from Poland ($49,633, a difference of 0.0%), Immigrants from Northern Africa ($49,648, a difference of 0.030%), Immigrants from Afghanistan ($49,645, a difference of 0.030%), Immigrants from North Macedonia ($49,658, a difference of 0.050%), and Immigrants from Lebanon ($49,682, a difference of 0.10%).
| Demographics | Rating | Rank | Median Earnings |
| Immigrants | Argentina | 99.2 /100 | #92 | Exceptional $49,841 |
| Armenians | 99.1 /100 | #93 | Exceptional $49,804 |
| Croatians | 99.0 /100 | #94 | Exceptional $49,724 |
| Immigrants | England | 99.0 /100 | #95 | Exceptional $49,722 |
| Immigrants | Lebanon | 99.0 /100 | #96 | Exceptional $49,682 |
| Immigrants | North Macedonia | 98.9 /100 | #97 | Exceptional $49,658 |
| Immigrants | Northern Africa | 98.9 /100 | #98 | Exceptional $49,648 |
| Immigrants | Afghanistan | 98.9 /100 | #99 | Exceptional $49,645 |
| Immigrants | Poland | 98.9 /100 | #100 | Exceptional $49,633 |
| Jordanians | 98.9 /100 | #101 | Exceptional $49,632 |
| Ethiopians | 98.8 /100 | #102 | Exceptional $49,572 |
| Austrians | 98.7 /100 | #103 | Exceptional $49,501 |
| Immigrants | Brazil | 98.6 /100 | #104 | Exceptional $49,463 |
| Immigrants | Western Asia | 98.4 /100 | #105 | Exceptional $49,389 |
| Immigrants | Albania | 98.4 /100 | #106 | Exceptional $49,377 |
| Immigrants | Morocco | 98.4 /100 | #107 | Exceptional $49,368 |
| Palestinians | 98.0 /100 | #108 | Exceptional $49,209 |
| Syrians | 97.1 /100 | #109 | Exceptional $48,934 |
| Immigrants | Ethiopia | 97.1 /100 | #110 | Exceptional $48,924 |
| Immigrants | Zimbabwe | 97.0 /100 | #111 | Exceptional $48,913 |
| Northern Europeans | 96.9 /100 | #112 | Exceptional $48,887 |