Austrian vs Immigrants from Fiji Median Earnings
COMPARE
Austrian
Immigrants from Fiji
Median Earnings
Median Earnings Comparison
Austrians
Immigrants from Fiji
$49,501
MEDIAN EARNINGS
98.7/ 100
METRIC RATING
103rd/ 347
METRIC RANK
$48,305
MEDIAN EARNINGS
93.3/ 100
METRIC RATING
125th/ 347
METRIC RANK
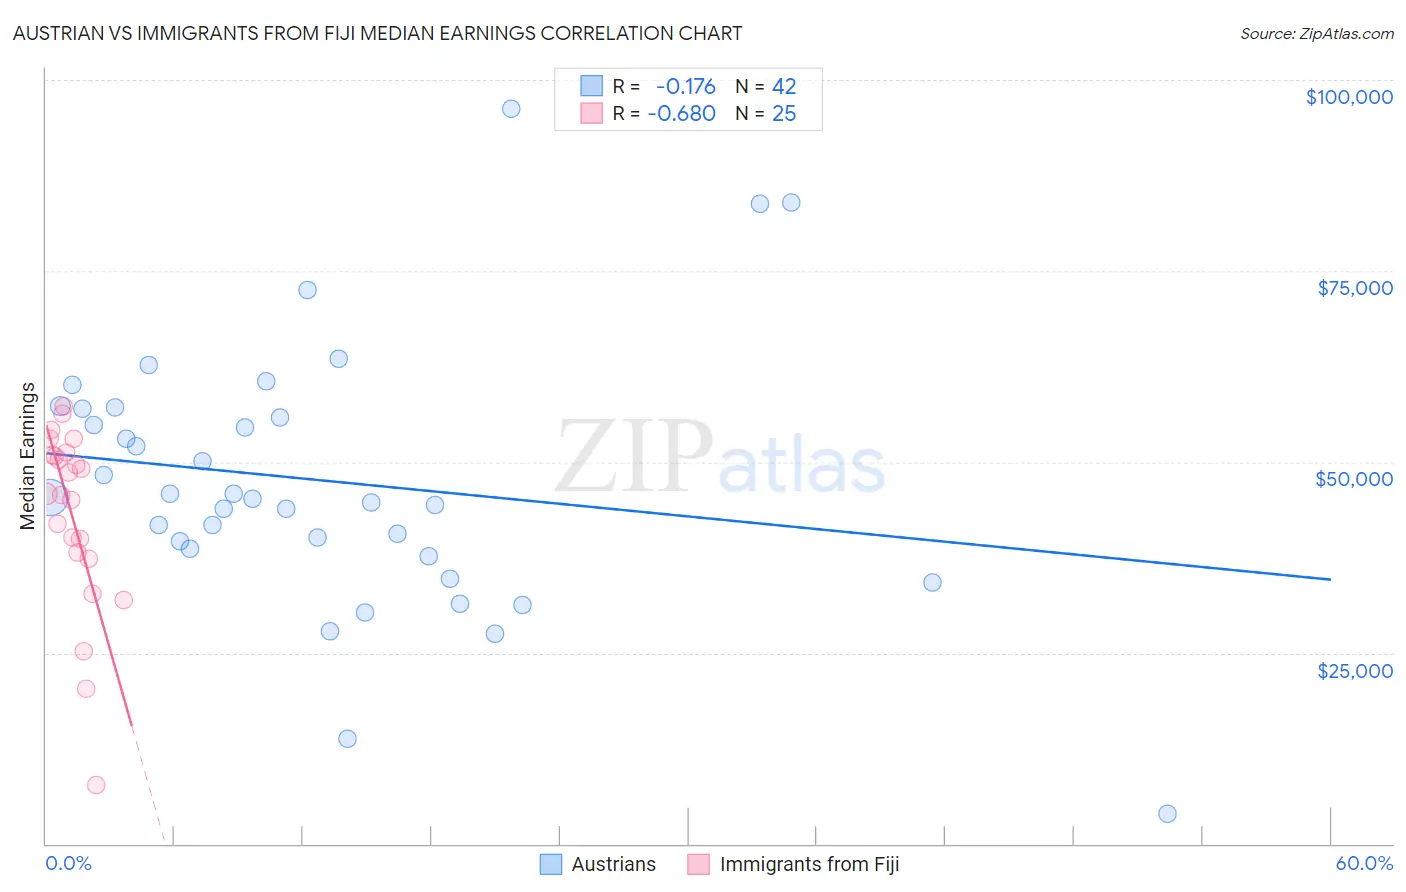
Austrian vs Immigrants from Fiji Median Earnings Correlation Chart
The statistical analysis conducted on geographies consisting of 452,042,983 people shows a poor negative correlation between the proportion of Austrians and median earnings in the United States with a correlation coefficient (R) of -0.176 and weighted average of $49,501. Similarly, the statistical analysis conducted on geographies consisting of 93,756,016 people shows a significant negative correlation between the proportion of Immigrants from Fiji and median earnings in the United States with a correlation coefficient (R) of -0.680 and weighted average of $48,305, a difference of 2.5%.
Median Earnings Correlation Summary
| Measurement | Austrian | Immigrants from Fiji |
| Minimum | $3,902 | $7,703 |
| Maximum | $96,250 | $57,229 |
| Range | $92,348 | $49,526 |
| Mean | $47,542 | $43,044 |
| Median | $45,255 | $45,776 |
| Interquartile 25% (IQ1) | $38,609 | $37,711 |
| Interquartile 75% (IQ3) | $56,967 | $51,118 |
| Interquartile Range (IQR) | $18,358 | $13,407 |
| Standard Deviation (Sample) | $17,409 | $12,014 |
| Standard Deviation (Population) | $17,200 | $11,772 |
Similar Demographics by Median Earnings
Demographics Similar to Austrians by Median Earnings
In terms of median earnings, the demographic groups most similar to Austrians are Immigrants from Brazil ($49,463, a difference of 0.080%), Ethiopian ($49,572, a difference of 0.14%), Immigrants from Western Asia ($49,389, a difference of 0.23%), Immigrants from Albania ($49,377, a difference of 0.25%), and Immigrants from Poland ($49,633, a difference of 0.27%).
| Demographics | Rating | Rank | Median Earnings |
| Immigrants | Lebanon | 99.0 /100 | #96 | Exceptional $49,682 |
| Immigrants | North Macedonia | 98.9 /100 | #97 | Exceptional $49,658 |
| Immigrants | Northern Africa | 98.9 /100 | #98 | Exceptional $49,648 |
| Immigrants | Afghanistan | 98.9 /100 | #99 | Exceptional $49,645 |
| Immigrants | Poland | 98.9 /100 | #100 | Exceptional $49,633 |
| Jordanians | 98.9 /100 | #101 | Exceptional $49,632 |
| Ethiopians | 98.8 /100 | #102 | Exceptional $49,572 |
| Austrians | 98.7 /100 | #103 | Exceptional $49,501 |
| Immigrants | Brazil | 98.6 /100 | #104 | Exceptional $49,463 |
| Immigrants | Western Asia | 98.4 /100 | #105 | Exceptional $49,389 |
| Immigrants | Albania | 98.4 /100 | #106 | Exceptional $49,377 |
| Immigrants | Morocco | 98.4 /100 | #107 | Exceptional $49,368 |
| Palestinians | 98.0 /100 | #108 | Exceptional $49,209 |
| Syrians | 97.1 /100 | #109 | Exceptional $48,934 |
| Immigrants | Ethiopia | 97.1 /100 | #110 | Exceptional $48,924 |
Demographics Similar to Immigrants from Fiji by Median Earnings
In terms of median earnings, the demographic groups most similar to Immigrants from Fiji are Assyrian/Chaldean/Syriac ($48,304, a difference of 0.0%), Sierra Leonean ($48,286, a difference of 0.040%), Immigrants from Philippines ($48,266, a difference of 0.080%), Brazilian ($48,356, a difference of 0.11%), and Pakistani ($48,254, a difference of 0.11%).
| Demographics | Rating | Rank | Median Earnings |
| Immigrants | Jordan | 95.9 /100 | #118 | Exceptional $48,673 |
| Poles | 95.8 /100 | #119 | Exceptional $48,659 |
| Carpatho Rusyns | 95.5 /100 | #120 | Exceptional $48,617 |
| Arabs | 95.4 /100 | #121 | Exceptional $48,599 |
| Chileans | 94.8 /100 | #122 | Exceptional $48,504 |
| Immigrants | Syria | 93.9 /100 | #123 | Exceptional $48,375 |
| Brazilians | 93.7 /100 | #124 | Exceptional $48,356 |
| Immigrants | Fiji | 93.3 /100 | #125 | Exceptional $48,305 |
| Assyrians/Chaldeans/Syriacs | 93.3 /100 | #126 | Exceptional $48,304 |
| Sierra Leoneans | 93.1 /100 | #127 | Exceptional $48,286 |
| Immigrants | Philippines | 92.9 /100 | #128 | Exceptional $48,266 |
| Pakistanis | 92.8 /100 | #129 | Exceptional $48,254 |
| Zimbabweans | 92.6 /100 | #130 | Exceptional $48,229 |
| Lebanese | 92.5 /100 | #131 | Exceptional $48,226 |
| British | 92.2 /100 | #132 | Exceptional $48,189 |