Austrian vs Central American College, 1 year or more
COMPARE
Austrian
Central American
College, 1 year or more
College, 1 year or more Comparison
Austrians
Central Americans
61.8%
COLLEGE, 1 YEAR OR MORE
95.4/ 100
METRIC RATING
112th/ 347
METRIC RANK
52.1%
COLLEGE, 1 YEAR OR MORE
0.0/ 100
METRIC RATING
304th/ 347
METRIC RANK
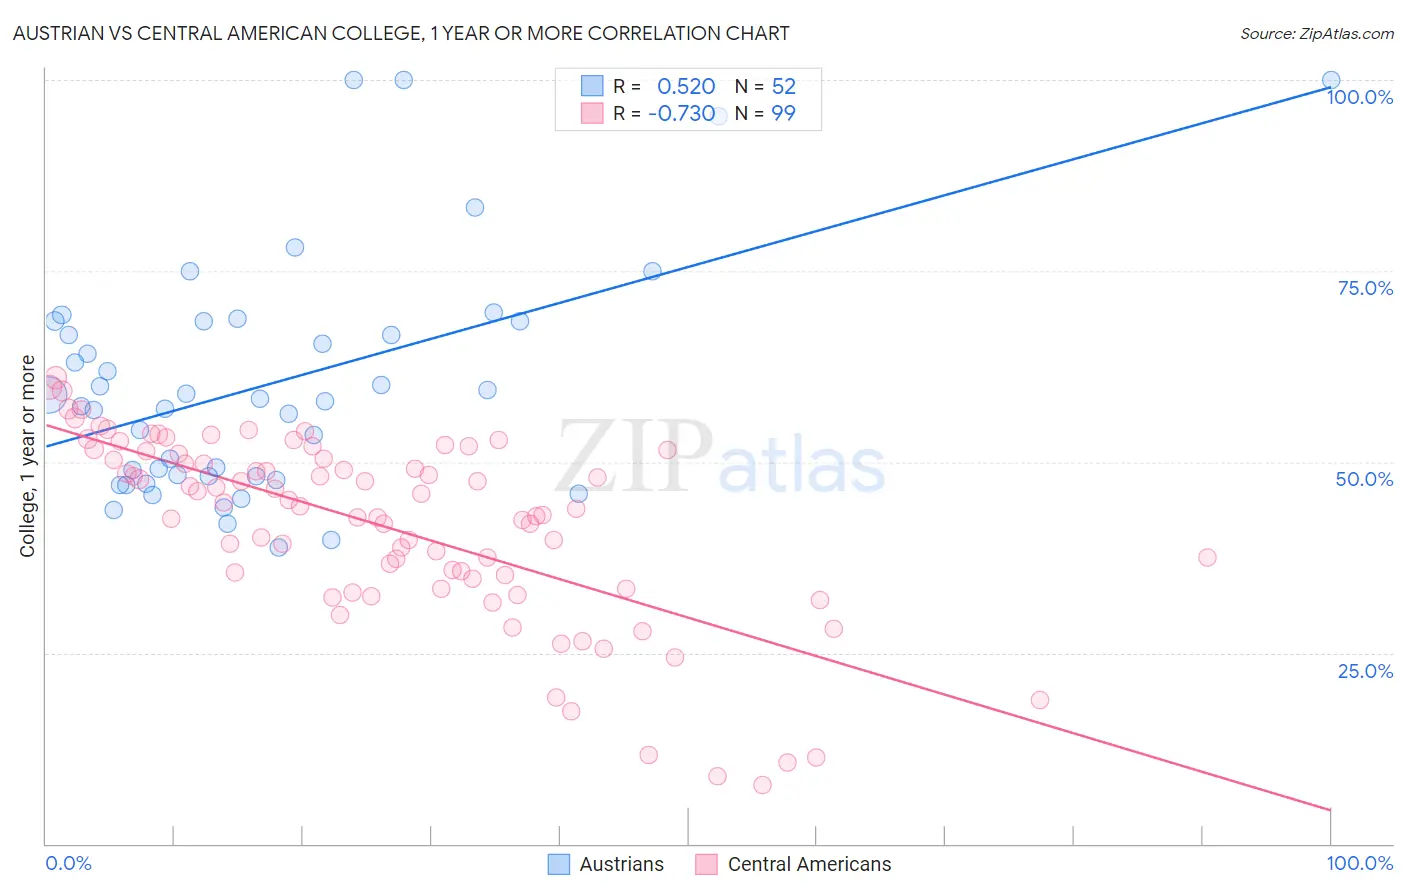
Austrian vs Central American College, 1 year or more Correlation Chart
The statistical analysis conducted on geographies consisting of 452,079,126 people shows a substantial positive correlation between the proportion of Austrians and percentage of population with at least college, 1 year or more education in the United States with a correlation coefficient (R) of 0.520 and weighted average of 61.8%. Similarly, the statistical analysis conducted on geographies consisting of 504,614,076 people shows a strong negative correlation between the proportion of Central Americans and percentage of population with at least college, 1 year or more education in the United States with a correlation coefficient (R) of -0.730 and weighted average of 52.1%, a difference of 18.6%.
College, 1 year or more Correlation Summary
| Measurement | Austrian | Central American |
| Minimum | 38.8% | 7.7% |
| Maximum | 100.0% | 61.1% |
| Range | 61.2% | 53.4% |
| Mean | 60.2% | 41.6% |
| Median | 58.1% | 44.2% |
| Interquartile 25% (IQ1) | 48.1% | 34.7% |
| Interquartile 75% (IQ3) | 68.4% | 51.0% |
| Interquartile Range (IQR) | 20.3% | 16.4% |
| Standard Deviation (Sample) | 15.3% | 12.1% |
| Standard Deviation (Population) | 15.2% | 12.1% |
Similar Demographics by College, 1 year or more
Demographics Similar to Austrians by College, 1 year or more
In terms of college, 1 year or more, the demographic groups most similar to Austrians are European (61.8%, a difference of 0.060%), Macedonian (61.8%, a difference of 0.060%), Ukrainian (61.8%, a difference of 0.070%), Syrian (61.9%, a difference of 0.080%), and Immigrants from Northern Africa (61.9%, a difference of 0.080%).
| Demographics | Rating | Rank | College, 1 year or more |
| Immigrants | Nepal | 96.3 /100 | #105 | Exceptional 62.0% |
| Palestinians | 96.3 /100 | #106 | Exceptional 62.0% |
| Immigrants | Ukraine | 95.8 /100 | #107 | Exceptional 61.9% |
| Syrians | 95.7 /100 | #108 | Exceptional 61.9% |
| Immigrants | Northern Africa | 95.7 /100 | #109 | Exceptional 61.9% |
| Europeans | 95.6 /100 | #110 | Exceptional 61.8% |
| Macedonians | 95.6 /100 | #111 | Exceptional 61.8% |
| Austrians | 95.4 /100 | #112 | Exceptional 61.8% |
| Ukrainians | 95.2 /100 | #113 | Exceptional 61.8% |
| Danes | 94.8 /100 | #114 | Exceptional 61.7% |
| Norwegians | 94.5 /100 | #115 | Exceptional 61.7% |
| Lebanese | 94.1 /100 | #116 | Exceptional 61.6% |
| Arabs | 93.9 /100 | #117 | Exceptional 61.6% |
| Immigrants | Brazil | 93.9 /100 | #118 | Exceptional 61.6% |
| Assyrians/Chaldeans/Syriacs | 93.3 /100 | #119 | Exceptional 61.5% |
Demographics Similar to Central Americans by College, 1 year or more
In terms of college, 1 year or more, the demographic groups most similar to Central Americans are Seminole (52.1%, a difference of 0.10%), Creek (52.2%, a difference of 0.14%), Puerto Rican (52.2%, a difference of 0.21%), Haitian (52.3%, a difference of 0.34%), and Choctaw (52.3%, a difference of 0.40%).
| Demographics | Rating | Rank | College, 1 year or more |
| Paiute | 0.0 /100 | #297 | Tragic 52.9% |
| Immigrants | Dominica | 0.0 /100 | #298 | Tragic 52.5% |
| Immigrants | Nicaragua | 0.0 /100 | #299 | Tragic 52.4% |
| Choctaw | 0.0 /100 | #300 | Tragic 52.3% |
| Haitians | 0.0 /100 | #301 | Tragic 52.3% |
| Puerto Ricans | 0.0 /100 | #302 | Tragic 52.2% |
| Creek | 0.0 /100 | #303 | Tragic 52.2% |
| Central Americans | 0.0 /100 | #304 | Tragic 52.1% |
| Seminole | 0.0 /100 | #305 | Tragic 52.1% |
| Mexican American Indians | 0.0 /100 | #306 | Tragic 51.9% |
| Immigrants | Portugal | 0.0 /100 | #307 | Tragic 51.9% |
| Salvadorans | 0.0 /100 | #308 | Tragic 51.8% |
| Apache | 0.0 /100 | #309 | Tragic 51.8% |
| Hondurans | 0.0 /100 | #310 | Tragic 51.6% |
| Immigrants | Haiti | 0.0 /100 | #311 | Tragic 51.5% |