Cuban vs Immigrants from Netherlands Median Earnings
COMPARE
Cuban
Immigrants from Netherlands
Median Earnings
Median Earnings Comparison
Cubans
Immigrants from Netherlands
$40,619
MEDIAN EARNINGS
0.0/ 100
METRIC RATING
308th/ 347
METRIC RANK
$50,818
MEDIAN EARNINGS
99.8/ 100
METRIC RATING
73rd/ 347
METRIC RANK
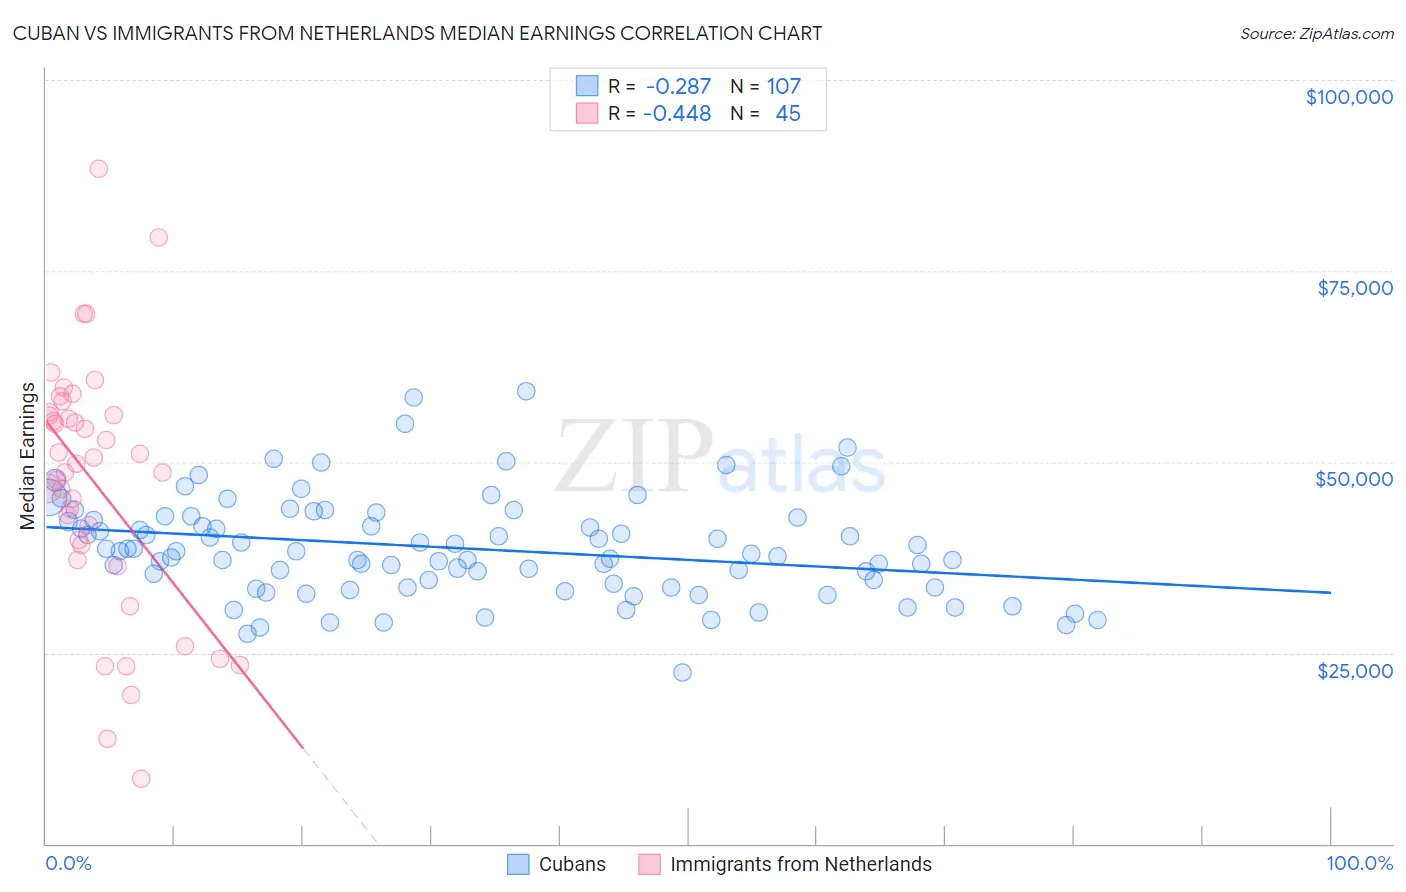
Cuban vs Immigrants from Netherlands Median Earnings Correlation Chart
The statistical analysis conducted on geographies consisting of 449,351,529 people shows a weak negative correlation between the proportion of Cubans and median earnings in the United States with a correlation coefficient (R) of -0.287 and weighted average of $40,619. Similarly, the statistical analysis conducted on geographies consisting of 237,873,103 people shows a moderate negative correlation between the proportion of Immigrants from Netherlands and median earnings in the United States with a correlation coefficient (R) of -0.448 and weighted average of $50,818, a difference of 25.1%.
Median Earnings Correlation Summary
| Measurement | Cuban | Immigrants from Netherlands |
| Minimum | $22,371 | $8,447 |
| Maximum | $59,236 | $88,336 |
| Range | $36,865 | $79,889 |
| Mean | $38,708 | $47,130 |
| Median | $38,230 | $49,796 |
| Interquartile 25% (IQ1) | $33,586 | $38,138 |
| Interquartile 75% (IQ3) | $42,663 | $56,269 |
| Interquartile Range (IQR) | $9,077 | $18,130 |
| Standard Deviation (Sample) | $6,670 | $16,545 |
| Standard Deviation (Population) | $6,639 | $16,360 |
Similar Demographics by Median Earnings
Demographics Similar to Cubans by Median Earnings
In terms of median earnings, the demographic groups most similar to Cubans are Honduran ($40,638, a difference of 0.050%), Yaqui ($40,647, a difference of 0.070%), Chickasaw ($40,672, a difference of 0.13%), Immigrants from Haiti ($40,550, a difference of 0.17%), and Immigrants from Guatemala ($40,851, a difference of 0.57%).
| Demographics | Rating | Rank | Median Earnings |
| Immigrants | Latin America | 0.1 /100 | #301 | Tragic $41,049 |
| Shoshone | 0.0 /100 | #302 | Tragic $40,932 |
| Haitians | 0.0 /100 | #303 | Tragic $40,918 |
| Immigrants | Guatemala | 0.0 /100 | #304 | Tragic $40,851 |
| Chickasaw | 0.0 /100 | #305 | Tragic $40,672 |
| Yaqui | 0.0 /100 | #306 | Tragic $40,647 |
| Hondurans | 0.0 /100 | #307 | Tragic $40,638 |
| Cubans | 0.0 /100 | #308 | Tragic $40,619 |
| Immigrants | Haiti | 0.0 /100 | #309 | Tragic $40,550 |
| Apache | 0.0 /100 | #310 | Tragic $40,388 |
| Hispanics or Latinos | 0.0 /100 | #311 | Tragic $40,288 |
| Chippewa | 0.0 /100 | #312 | Tragic $40,287 |
| Choctaw | 0.0 /100 | #313 | Tragic $40,270 |
| Cheyenne | 0.0 /100 | #314 | Tragic $40,233 |
| Seminole | 0.0 /100 | #315 | Tragic $40,233 |
Demographics Similar to Immigrants from Netherlands by Median Earnings
In terms of median earnings, the demographic groups most similar to Immigrants from Netherlands are South African ($50,752, a difference of 0.13%), Immigrants from Scotland ($50,741, a difference of 0.15%), Immigrants from Egypt ($50,901, a difference of 0.16%), Immigrants from Ukraine ($50,984, a difference of 0.33%), and Lithuanian ($50,991, a difference of 0.34%).
| Demographics | Rating | Rank | Median Earnings |
| Afghans | 99.9 /100 | #66 | Exceptional $51,112 |
| Immigrants | Spain | 99.9 /100 | #67 | Exceptional $51,092 |
| Paraguayans | 99.9 /100 | #68 | Exceptional $51,068 |
| Mongolians | 99.8 /100 | #69 | Exceptional $51,038 |
| Lithuanians | 99.8 /100 | #70 | Exceptional $50,991 |
| Immigrants | Ukraine | 99.8 /100 | #71 | Exceptional $50,984 |
| Immigrants | Egypt | 99.8 /100 | #72 | Exceptional $50,901 |
| Immigrants | Netherlands | 99.8 /100 | #73 | Exceptional $50,818 |
| South Africans | 99.8 /100 | #74 | Exceptional $50,752 |
| Immigrants | Scotland | 99.8 /100 | #75 | Exceptional $50,741 |
| Immigrants | Italy | 99.7 /100 | #76 | Exceptional $50,581 |
| Immigrants | Western Europe | 99.7 /100 | #77 | Exceptional $50,549 |
| Argentineans | 99.6 /100 | #78 | Exceptional $50,399 |
| Laotians | 99.6 /100 | #79 | Exceptional $50,343 |
| Ukrainians | 99.6 /100 | #80 | Exceptional $50,320 |