Nicaraguan vs Immigrants from Netherlands Median Earnings
COMPARE
Nicaraguan
Immigrants from Netherlands
Median Earnings
Median Earnings Comparison
Nicaraguans
Immigrants from Netherlands
$43,026
MEDIAN EARNINGS
0.8/ 100
METRIC RATING
262nd/ 347
METRIC RANK
$50,818
MEDIAN EARNINGS
99.8/ 100
METRIC RATING
73rd/ 347
METRIC RANK
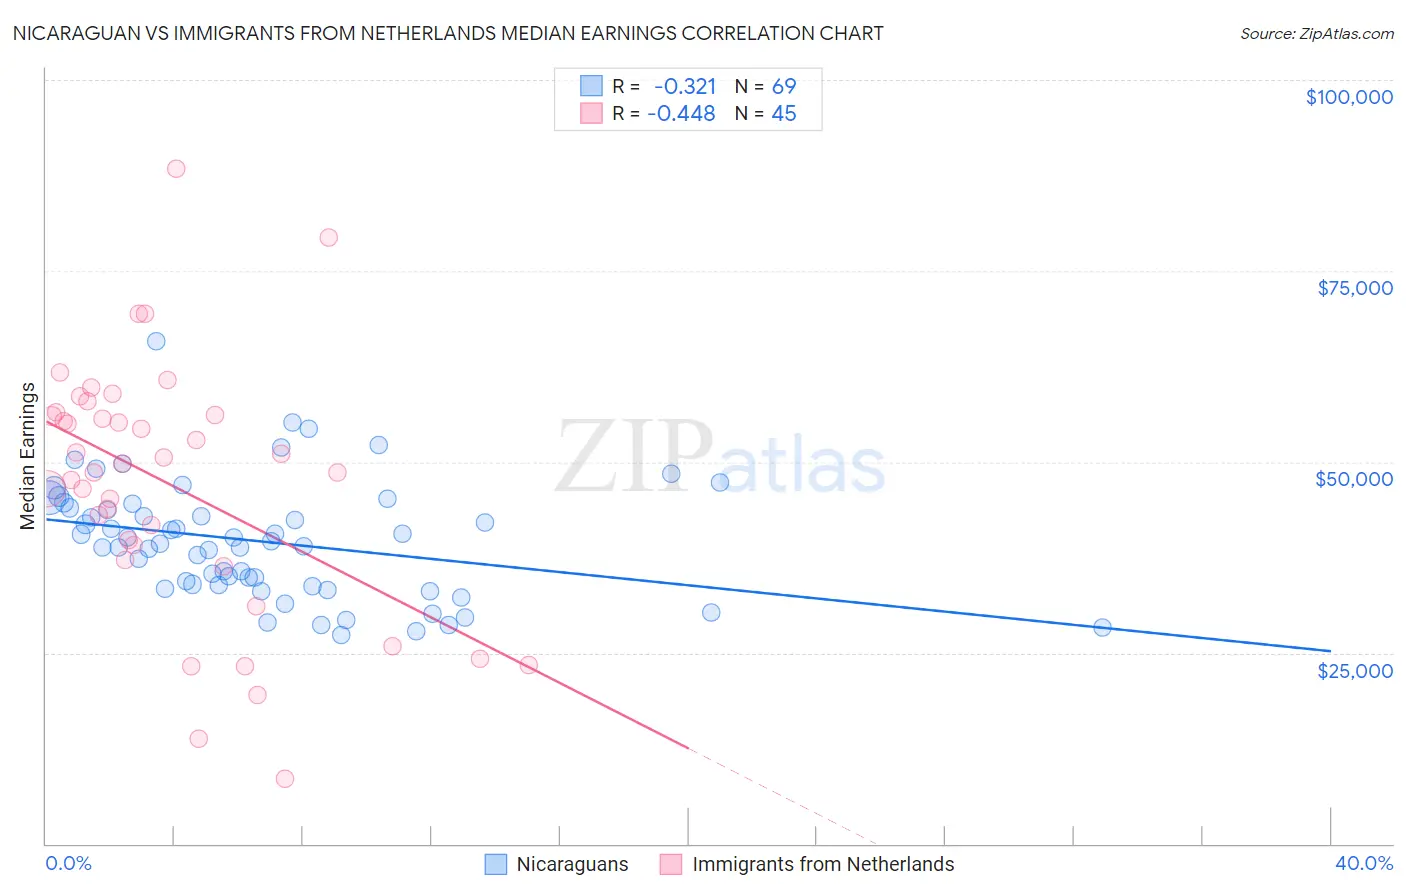
Nicaraguan vs Immigrants from Netherlands Median Earnings Correlation Chart
The statistical analysis conducted on geographies consisting of 285,714,618 people shows a mild negative correlation between the proportion of Nicaraguans and median earnings in the United States with a correlation coefficient (R) of -0.321 and weighted average of $43,026. Similarly, the statistical analysis conducted on geographies consisting of 237,873,103 people shows a moderate negative correlation between the proportion of Immigrants from Netherlands and median earnings in the United States with a correlation coefficient (R) of -0.448 and weighted average of $50,818, a difference of 18.1%.
Median Earnings Correlation Summary
| Measurement | Nicaraguan | Immigrants from Netherlands |
| Minimum | $27,330 | $8,447 |
| Maximum | $65,764 | $88,336 |
| Range | $38,434 | $79,889 |
| Mean | $39,567 | $47,130 |
| Median | $39,352 | $49,796 |
| Interquartile 25% (IQ1) | $33,795 | $38,138 |
| Interquartile 75% (IQ3) | $44,292 | $56,269 |
| Interquartile Range (IQR) | $10,497 | $18,130 |
| Standard Deviation (Sample) | $7,612 | $16,545 |
| Standard Deviation (Population) | $7,557 | $16,360 |
Similar Demographics by Median Earnings
Demographics Similar to Nicaraguans by Median Earnings
In terms of median earnings, the demographic groups most similar to Nicaraguans are Immigrants from Jamaica ($43,026, a difference of 0.0%), Inupiat ($43,000, a difference of 0.060%), Immigrants from Somalia ($43,100, a difference of 0.17%), Immigrants from Liberia ($42,923, a difference of 0.24%), and Salvadoran ($42,912, a difference of 0.27%).
| Demographics | Rating | Rank | Median Earnings |
| Immigrants | Middle Africa | 1.4 /100 | #255 | Tragic $43,416 |
| Alaskan Athabascans | 1.4 /100 | #256 | Tragic $43,393 |
| Jamaicans | 1.3 /100 | #257 | Tragic $43,343 |
| French American Indians | 1.3 /100 | #258 | Tragic $43,333 |
| German Russians | 1.1 /100 | #259 | Tragic $43,200 |
| Immigrants | Somalia | 0.9 /100 | #260 | Tragic $43,100 |
| Immigrants | Jamaica | 0.8 /100 | #261 | Tragic $43,026 |
| Nicaraguans | 0.8 /100 | #262 | Tragic $43,026 |
| Inupiat | 0.8 /100 | #263 | Tragic $43,000 |
| Immigrants | Liberia | 0.7 /100 | #264 | Tragic $42,923 |
| Salvadorans | 0.7 /100 | #265 | Tragic $42,912 |
| Immigrants | Laos | 0.7 /100 | #266 | Tragic $42,884 |
| Cree | 0.6 /100 | #267 | Tragic $42,777 |
| Americans | 0.6 /100 | #268 | Tragic $42,742 |
| Belizeans | 0.5 /100 | #269 | Tragic $42,702 |
Demographics Similar to Immigrants from Netherlands by Median Earnings
In terms of median earnings, the demographic groups most similar to Immigrants from Netherlands are South African ($50,752, a difference of 0.13%), Immigrants from Scotland ($50,741, a difference of 0.15%), Immigrants from Egypt ($50,901, a difference of 0.16%), Immigrants from Ukraine ($50,984, a difference of 0.33%), and Lithuanian ($50,991, a difference of 0.34%).
| Demographics | Rating | Rank | Median Earnings |
| Afghans | 99.9 /100 | #66 | Exceptional $51,112 |
| Immigrants | Spain | 99.9 /100 | #67 | Exceptional $51,092 |
| Paraguayans | 99.9 /100 | #68 | Exceptional $51,068 |
| Mongolians | 99.8 /100 | #69 | Exceptional $51,038 |
| Lithuanians | 99.8 /100 | #70 | Exceptional $50,991 |
| Immigrants | Ukraine | 99.8 /100 | #71 | Exceptional $50,984 |
| Immigrants | Egypt | 99.8 /100 | #72 | Exceptional $50,901 |
| Immigrants | Netherlands | 99.8 /100 | #73 | Exceptional $50,818 |
| South Africans | 99.8 /100 | #74 | Exceptional $50,752 |
| Immigrants | Scotland | 99.8 /100 | #75 | Exceptional $50,741 |
| Immigrants | Italy | 99.7 /100 | #76 | Exceptional $50,581 |
| Immigrants | Western Europe | 99.7 /100 | #77 | Exceptional $50,549 |
| Argentineans | 99.6 /100 | #78 | Exceptional $50,399 |
| Laotians | 99.6 /100 | #79 | Exceptional $50,343 |
| Ukrainians | 99.6 /100 | #80 | Exceptional $50,320 |