Assyrian/Chaldean/Syriac vs Immigrants from Netherlands Unemployment
COMPARE
Assyrian/Chaldean/Syriac
Immigrants from Netherlands
Unemployment
Unemployment Comparison
Assyrians/Chaldeans/Syriacs
Immigrants from Netherlands
5.3%
UNEMPLOYMENT
39.2/ 100
METRIC RATING
184th/ 347
METRIC RANK
4.9%
UNEMPLOYMENT
99.0/ 100
METRIC RATING
60th/ 347
METRIC RANK
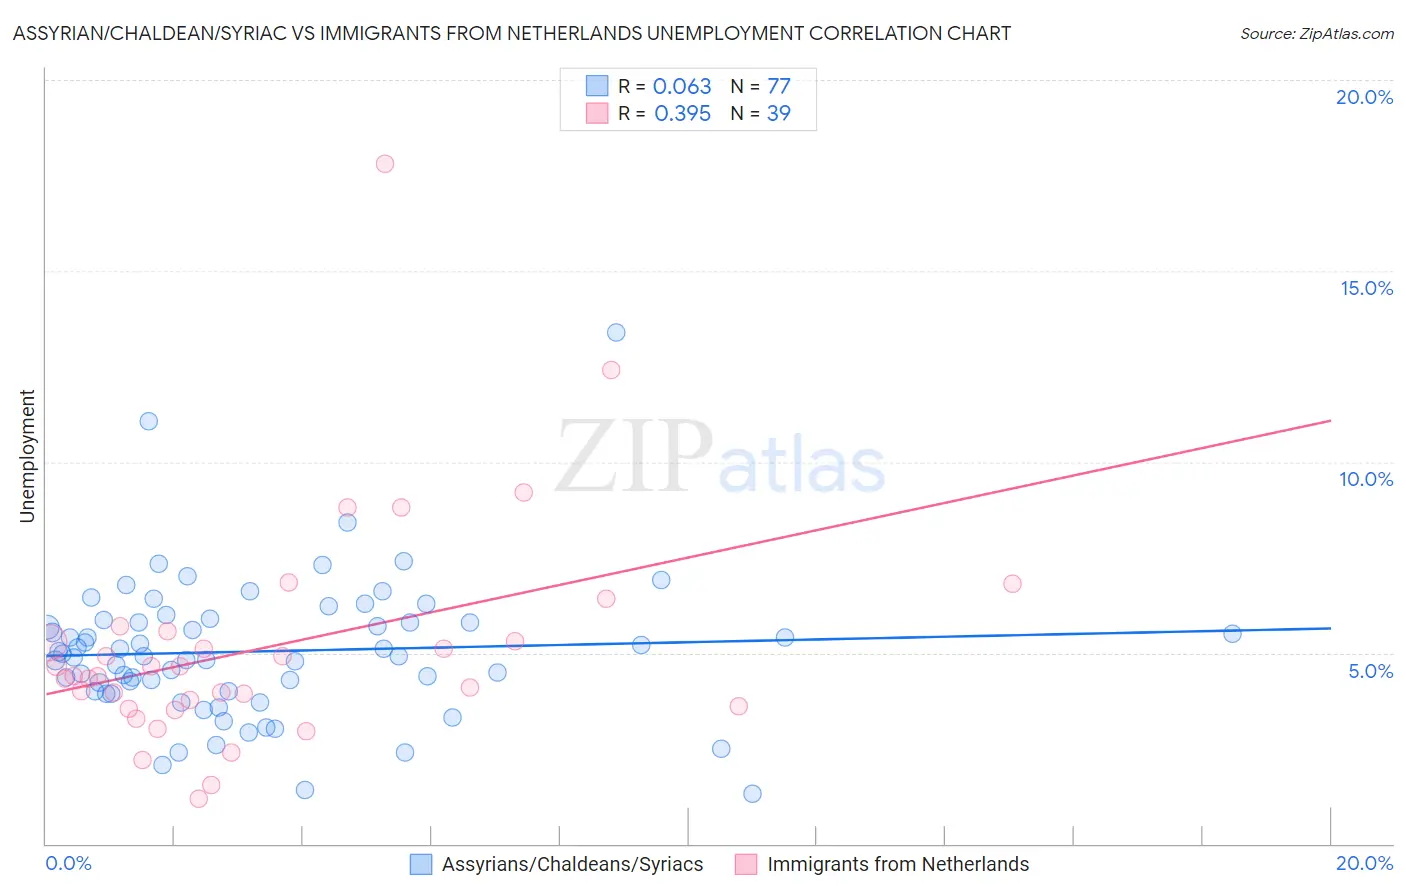
Assyrian/Chaldean/Syriac vs Immigrants from Netherlands Unemployment Correlation Chart
The statistical analysis conducted on geographies consisting of 110,292,838 people shows a slight positive correlation between the proportion of Assyrians/Chaldeans/Syriacs and unemployment in the United States with a correlation coefficient (R) of 0.063 and weighted average of 5.3%. Similarly, the statistical analysis conducted on geographies consisting of 237,753,486 people shows a mild positive correlation between the proportion of Immigrants from Netherlands and unemployment in the United States with a correlation coefficient (R) of 0.395 and weighted average of 4.9%, a difference of 8.2%.
Unemployment Correlation Summary
| Measurement | Assyrian/Chaldean/Syriac | Immigrants from Netherlands |
| Minimum | 1.3% | 1.2% |
| Maximum | 13.4% | 17.8% |
| Range | 12.1% | 16.6% |
| Mean | 5.0% | 5.2% |
| Median | 4.9% | 4.4% |
| Interquartile 25% (IQ1) | 4.0% | 3.6% |
| Interquartile 75% (IQ3) | 5.8% | 5.6% |
| Interquartile Range (IQR) | 1.8% | 2.0% |
| Standard Deviation (Sample) | 1.9% | 3.0% |
| Standard Deviation (Population) | 1.8% | 3.0% |
Similar Demographics by Unemployment
Demographics Similar to Assyrians/Chaldeans/Syriacs by Unemployment
In terms of unemployment, the demographic groups most similar to Assyrians/Chaldeans/Syriacs are Immigrants from Thailand (5.3%, a difference of 0.020%), Brazilian (5.3%, a difference of 0.060%), Immigrants from Uganda (5.3%, a difference of 0.090%), Costa Rican (5.3%, a difference of 0.12%), and Alsatian (5.3%, a difference of 0.14%).
| Demographics | Rating | Rank | Unemployment |
| Immigrants | Nonimmigrants | 47.9 /100 | #177 | Average 5.3% |
| Afghans | 47.4 /100 | #178 | Average 5.3% |
| Malaysians | 46.8 /100 | #179 | Average 5.3% |
| Immigrants | Greece | 45.0 /100 | #180 | Average 5.3% |
| Albanians | 43.5 /100 | #181 | Average 5.3% |
| Spaniards | 42.2 /100 | #182 | Average 5.3% |
| Brazilians | 40.2 /100 | #183 | Average 5.3% |
| Assyrians/Chaldeans/Syriacs | 39.2 /100 | #184 | Fair 5.3% |
| Immigrants | Thailand | 38.9 /100 | #185 | Fair 5.3% |
| Immigrants | Uganda | 37.8 /100 | #186 | Fair 5.3% |
| Costa Ricans | 37.4 /100 | #187 | Fair 5.3% |
| Alsatians | 37.0 /100 | #188 | Fair 5.3% |
| Immigrants | Belarus | 35.6 /100 | #189 | Fair 5.3% |
| Arabs | 35.3 /100 | #190 | Fair 5.3% |
| Somalis | 34.0 /100 | #191 | Fair 5.3% |
Demographics Similar to Immigrants from Netherlands by Unemployment
In terms of unemployment, the demographic groups most similar to Immigrants from Netherlands are Cambodian (4.9%, a difference of 0.0%), Icelander (4.9%, a difference of 0.010%), Immigrants from Bulgaria (4.9%, a difference of 0.030%), Bhutanese (4.9%, a difference of 0.050%), and Greek (4.9%, a difference of 0.070%).
| Demographics | Rating | Rank | Unemployment |
| Immigrants | Zimbabwe | 99.2 /100 | #53 | Exceptional 4.9% |
| Eastern Europeans | 99.2 /100 | #54 | Exceptional 4.9% |
| Australians | 99.2 /100 | #55 | Exceptional 4.9% |
| Celtics | 99.1 /100 | #56 | Exceptional 4.9% |
| Immigrants | Singapore | 99.1 /100 | #57 | Exceptional 4.9% |
| Greeks | 99.0 /100 | #58 | Exceptional 4.9% |
| Bhutanese | 99.0 /100 | #59 | Exceptional 4.9% |
| Immigrants | Netherlands | 99.0 /100 | #60 | Exceptional 4.9% |
| Cambodians | 99.0 /100 | #61 | Exceptional 4.9% |
| Icelanders | 98.9 /100 | #62 | Exceptional 4.9% |
| Immigrants | Bulgaria | 98.9 /100 | #63 | Exceptional 4.9% |
| Italians | 98.9 /100 | #64 | Exceptional 4.9% |
| Immigrants | Canada | 98.8 /100 | #65 | Exceptional 4.9% |
| Slovaks | 98.7 /100 | #66 | Exceptional 4.9% |
| New Zealanders | 98.6 /100 | #67 | Exceptional 4.9% |