Immigrants from Armenia vs Immigrants from Netherlands Median Earnings
COMPARE
Immigrants from Armenia
Immigrants from Netherlands
Median Earnings
Median Earnings Comparison
Immigrants from Armenia
Immigrants from Netherlands
$46,094
MEDIAN EARNINGS
38.3/ 100
METRIC RATING
188th/ 347
METRIC RANK
$50,818
MEDIAN EARNINGS
99.8/ 100
METRIC RATING
73rd/ 347
METRIC RANK
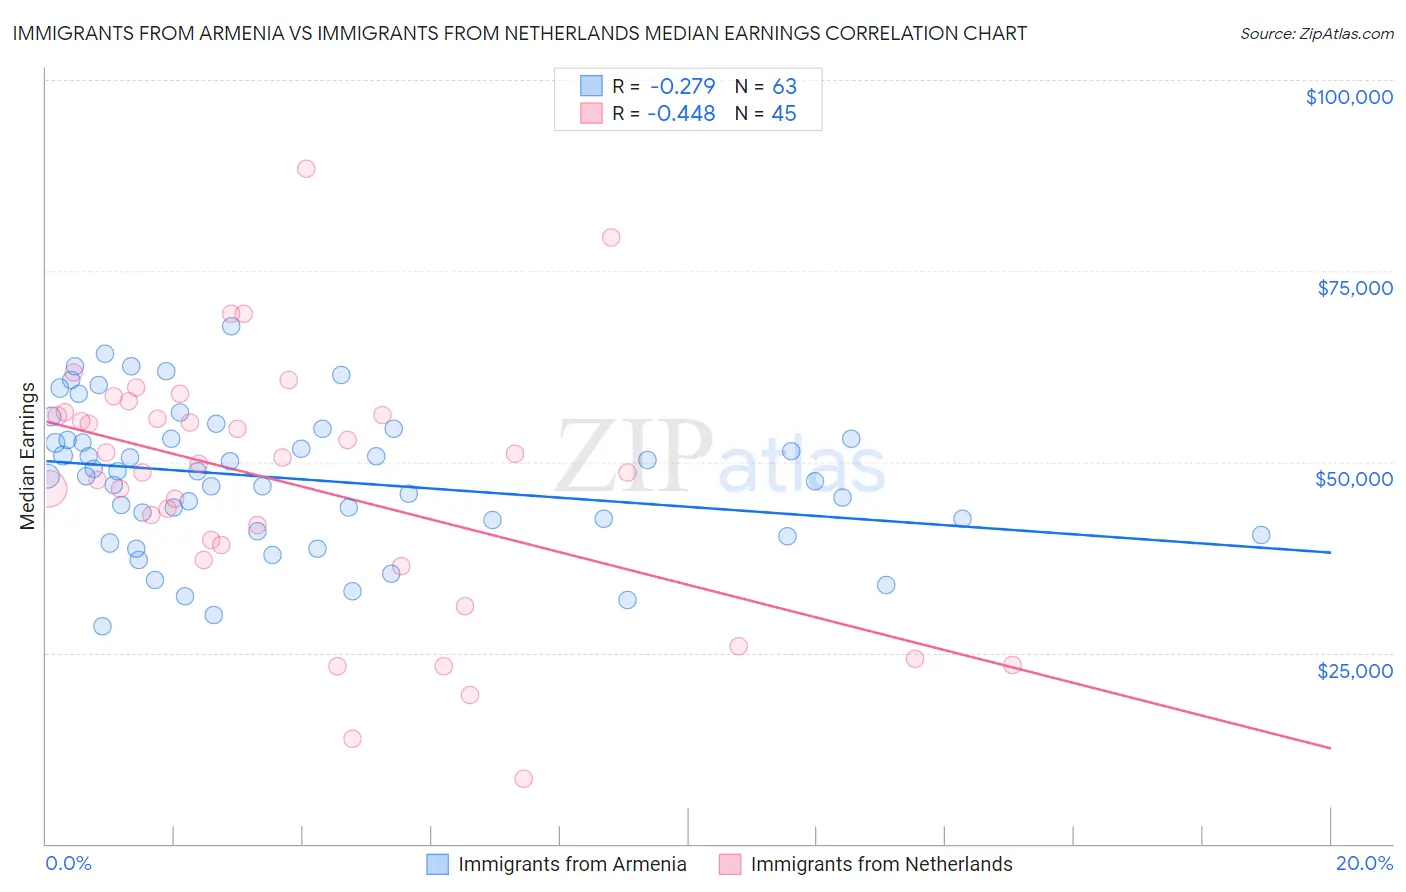
Immigrants from Armenia vs Immigrants from Netherlands Median Earnings Correlation Chart
The statistical analysis conducted on geographies consisting of 97,724,966 people shows a weak negative correlation between the proportion of Immigrants from Armenia and median earnings in the United States with a correlation coefficient (R) of -0.279 and weighted average of $46,094. Similarly, the statistical analysis conducted on geographies consisting of 237,873,103 people shows a moderate negative correlation between the proportion of Immigrants from Netherlands and median earnings in the United States with a correlation coefficient (R) of -0.448 and weighted average of $50,818, a difference of 10.2%.
Median Earnings Correlation Summary
| Measurement | Immigrants from Armenia | Immigrants from Netherlands |
| Minimum | $28,479 | $8,447 |
| Maximum | $67,833 | $88,336 |
| Range | $39,354 | $79,889 |
| Mean | $47,758 | $47,130 |
| Median | $48,131 | $49,796 |
| Interquartile 25% (IQ1) | $40,972 | $38,138 |
| Interquartile 75% (IQ3) | $53,018 | $56,269 |
| Interquartile Range (IQR) | $12,046 | $18,130 |
| Standard Deviation (Sample) | $9,191 | $16,545 |
| Standard Deviation (Population) | $9,118 | $16,360 |
Similar Demographics by Median Earnings
Demographics Similar to Immigrants from Armenia by Median Earnings
In terms of median earnings, the demographic groups most similar to Immigrants from Armenia are Spaniard ($46,059, a difference of 0.080%), Iraqi ($46,140, a difference of 0.10%), French Canadian ($46,026, a difference of 0.15%), Vietnamese ($46,172, a difference of 0.17%), and Uruguayan ($46,190, a difference of 0.21%).
| Demographics | Rating | Rank | Median Earnings |
| Immigrants | Cameroon | 46.4 /100 | #181 | Average $46,329 |
| Swiss | 45.9 /100 | #182 | Average $46,315 |
| French | 45.2 /100 | #183 | Average $46,296 |
| Immigrants | Kenya | 42.4 /100 | #184 | Average $46,214 |
| Uruguayans | 41.6 /100 | #185 | Average $46,190 |
| Vietnamese | 40.9 /100 | #186 | Average $46,172 |
| Iraqis | 39.9 /100 | #187 | Fair $46,140 |
| Immigrants | Armenia | 38.3 /100 | #188 | Fair $46,094 |
| Spaniards | 37.2 /100 | #189 | Fair $46,059 |
| French Canadians | 36.1 /100 | #190 | Fair $46,026 |
| Finns | 33.4 /100 | #191 | Fair $45,940 |
| Germans | 33.2 /100 | #192 | Fair $45,935 |
| Guamanians/Chamorros | 33.2 /100 | #193 | Fair $45,933 |
| Immigrants | Costa Rica | 33.0 /100 | #194 | Fair $45,928 |
| Immigrants | St. Vincent and the Grenadines | 32.4 /100 | #195 | Fair $45,908 |
Demographics Similar to Immigrants from Netherlands by Median Earnings
In terms of median earnings, the demographic groups most similar to Immigrants from Netherlands are South African ($50,752, a difference of 0.13%), Immigrants from Scotland ($50,741, a difference of 0.15%), Immigrants from Egypt ($50,901, a difference of 0.16%), Immigrants from Ukraine ($50,984, a difference of 0.33%), and Lithuanian ($50,991, a difference of 0.34%).
| Demographics | Rating | Rank | Median Earnings |
| Afghans | 99.9 /100 | #66 | Exceptional $51,112 |
| Immigrants | Spain | 99.9 /100 | #67 | Exceptional $51,092 |
| Paraguayans | 99.9 /100 | #68 | Exceptional $51,068 |
| Mongolians | 99.8 /100 | #69 | Exceptional $51,038 |
| Lithuanians | 99.8 /100 | #70 | Exceptional $50,991 |
| Immigrants | Ukraine | 99.8 /100 | #71 | Exceptional $50,984 |
| Immigrants | Egypt | 99.8 /100 | #72 | Exceptional $50,901 |
| Immigrants | Netherlands | 99.8 /100 | #73 | Exceptional $50,818 |
| South Africans | 99.8 /100 | #74 | Exceptional $50,752 |
| Immigrants | Scotland | 99.8 /100 | #75 | Exceptional $50,741 |
| Immigrants | Italy | 99.7 /100 | #76 | Exceptional $50,581 |
| Immigrants | Western Europe | 99.7 /100 | #77 | Exceptional $50,549 |
| Argentineans | 99.6 /100 | #78 | Exceptional $50,399 |
| Laotians | 99.6 /100 | #79 | Exceptional $50,343 |
| Ukrainians | 99.6 /100 | #80 | Exceptional $50,320 |