Assyrian/Chaldean/Syriac vs Immigrants from Netherlands No Schooling Completed
COMPARE
Assyrian/Chaldean/Syriac
Immigrants from Netherlands
No Schooling Completed
No Schooling Completed Comparison
Assyrians/Chaldeans/Syriacs
Immigrants from Netherlands
2.5%
NO SCHOOLING COMPLETED
0.6/ 100
METRIC RATING
258th/ 347
METRIC RANK
1.7%
NO SCHOOLING COMPLETED
99.6/ 100
METRIC RATING
70th/ 347
METRIC RANK
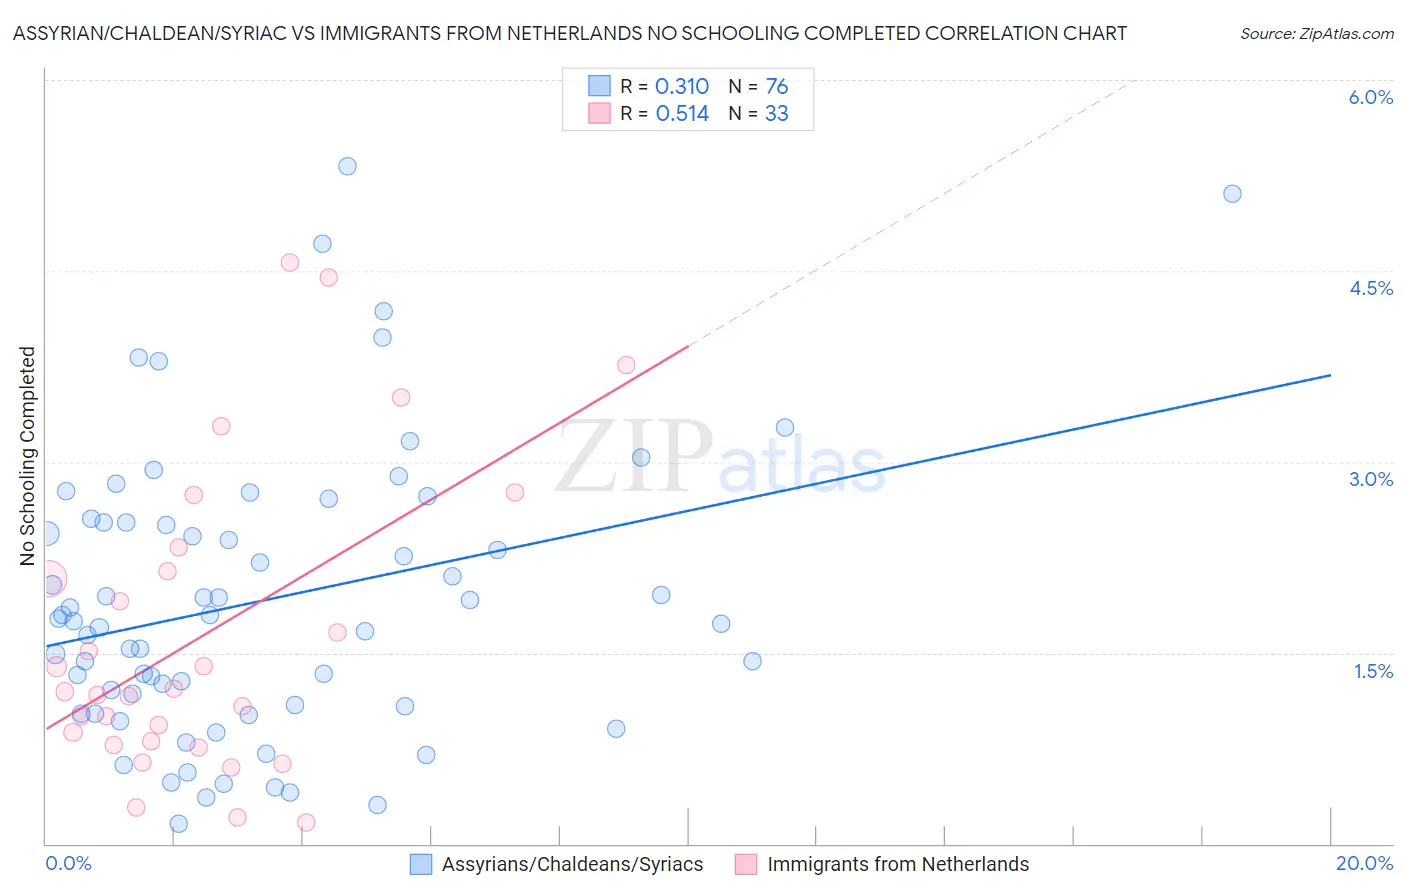
Assyrian/Chaldean/Syriac vs Immigrants from Netherlands No Schooling Completed Correlation Chart
The statistical analysis conducted on geographies consisting of 110,066,308 people shows a mild positive correlation between the proportion of Assyrians/Chaldeans/Syriacs and percentage of population with no schooling in the United States with a correlation coefficient (R) of 0.310 and weighted average of 2.5%. Similarly, the statistical analysis conducted on geographies consisting of 236,079,669 people shows a substantial positive correlation between the proportion of Immigrants from Netherlands and percentage of population with no schooling in the United States with a correlation coefficient (R) of 0.514 and weighted average of 1.7%, a difference of 43.4%.
No Schooling Completed Correlation Summary
| Measurement | Assyrian/Chaldean/Syriac | Immigrants from Netherlands |
| Minimum | 0.15% | 0.16% |
| Maximum | 5.3% | 4.6% |
| Range | 5.2% | 4.4% |
| Mean | 1.9% | 1.6% |
| Median | 1.8% | 1.2% |
| Interquartile 25% (IQ1) | 1.1% | 0.79% |
| Interquartile 75% (IQ3) | 2.5% | 2.2% |
| Interquartile Range (IQR) | 1.4% | 1.4% |
| Standard Deviation (Sample) | 1.1% | 1.2% |
| Standard Deviation (Population) | 1.1% | 1.2% |
Similar Demographics by No Schooling Completed
Demographics Similar to Assyrians/Chaldeans/Syriacs by No Schooling Completed
In terms of no schooling completed, the demographic groups most similar to Assyrians/Chaldeans/Syriacs are Immigrants from South America (2.5%, a difference of 0.030%), Immigrants from Jamaica (2.5%, a difference of 0.060%), Immigrants from Ethiopia (2.5%, a difference of 0.11%), Armenian (2.5%, a difference of 0.23%), and Immigrants from Sierra Leone (2.5%, a difference of 0.58%).
| Demographics | Rating | Rank | No Schooling Completed |
| Immigrants | Africa | 1.1 /100 | #251 | Tragic 2.4% |
| Immigrants | Colombia | 1.0 /100 | #252 | Tragic 2.4% |
| Immigrants | Asia | 0.9 /100 | #253 | Tragic 2.4% |
| Immigrants | Eastern Africa | 0.9 /100 | #254 | Tragic 2.4% |
| Ethiopians | 0.8 /100 | #255 | Tragic 2.4% |
| Yaqui | 0.8 /100 | #256 | Tragic 2.4% |
| Immigrants | South America | 0.6 /100 | #257 | Tragic 2.5% |
| Assyrians/Chaldeans/Syriacs | 0.6 /100 | #258 | Tragic 2.5% |
| Immigrants | Jamaica | 0.6 /100 | #259 | Tragic 2.5% |
| Immigrants | Ethiopia | 0.6 /100 | #260 | Tragic 2.5% |
| Armenians | 0.5 /100 | #261 | Tragic 2.5% |
| Immigrants | Sierra Leone | 0.5 /100 | #262 | Tragic 2.5% |
| Immigrants | Liberia | 0.4 /100 | #263 | Tragic 2.5% |
| Indians (Asian) | 0.4 /100 | #264 | Tragic 2.5% |
| West Indians | 0.4 /100 | #265 | Tragic 2.5% |
Demographics Similar to Immigrants from Netherlands by No Schooling Completed
In terms of no schooling completed, the demographic groups most similar to Immigrants from Netherlands are Immigrants from England (1.7%, a difference of 0.34%), Cajun (1.7%, a difference of 0.51%), Chickasaw (1.7%, a difference of 0.97%), Immigrants from India (1.7%, a difference of 1.0%), and Zimbabwean (1.7%, a difference of 1.0%).
| Demographics | Rating | Rank | No Schooling Completed |
| Russians | 99.8 /100 | #63 | Exceptional 1.7% |
| New Zealanders | 99.7 /100 | #64 | Exceptional 1.7% |
| Serbians | 99.7 /100 | #65 | Exceptional 1.7% |
| Canadians | 99.7 /100 | #66 | Exceptional 1.7% |
| Immigrants | Austria | 99.7 /100 | #67 | Exceptional 1.7% |
| Immigrants | Lithuania | 99.7 /100 | #68 | Exceptional 1.7% |
| Chickasaw | 99.6 /100 | #69 | Exceptional 1.7% |
| Immigrants | Netherlands | 99.6 /100 | #70 | Exceptional 1.7% |
| Immigrants | England | 99.5 /100 | #71 | Exceptional 1.7% |
| Cajuns | 99.5 /100 | #72 | Exceptional 1.7% |
| Immigrants | India | 99.4 /100 | #73 | Exceptional 1.7% |
| Zimbabweans | 99.4 /100 | #74 | Exceptional 1.7% |
| Immigrants | Belgium | 99.3 /100 | #75 | Exceptional 1.7% |
| Cherokee | 99.3 /100 | #76 | Exceptional 1.7% |
| Immigrants | Sweden | 99.3 /100 | #77 | Exceptional 1.7% |