Immigrants from Costa Rica vs Immigrants from Egypt Householder Income Over 65 years
COMPARE
Immigrants from Costa Rica
Immigrants from Egypt
Householder Income Over 65 years
Householder Income Over 65 years Comparison
Immigrants from Costa Rica
Immigrants from Egypt
$59,848
HOUSEHOLDER INCOME OVER 65 YEARS
23.6/ 100
METRIC RATING
193rd/ 347
METRIC RANK
$64,299
HOUSEHOLDER INCOME OVER 65 YEARS
97.0/ 100
METRIC RATING
94th/ 347
METRIC RANK
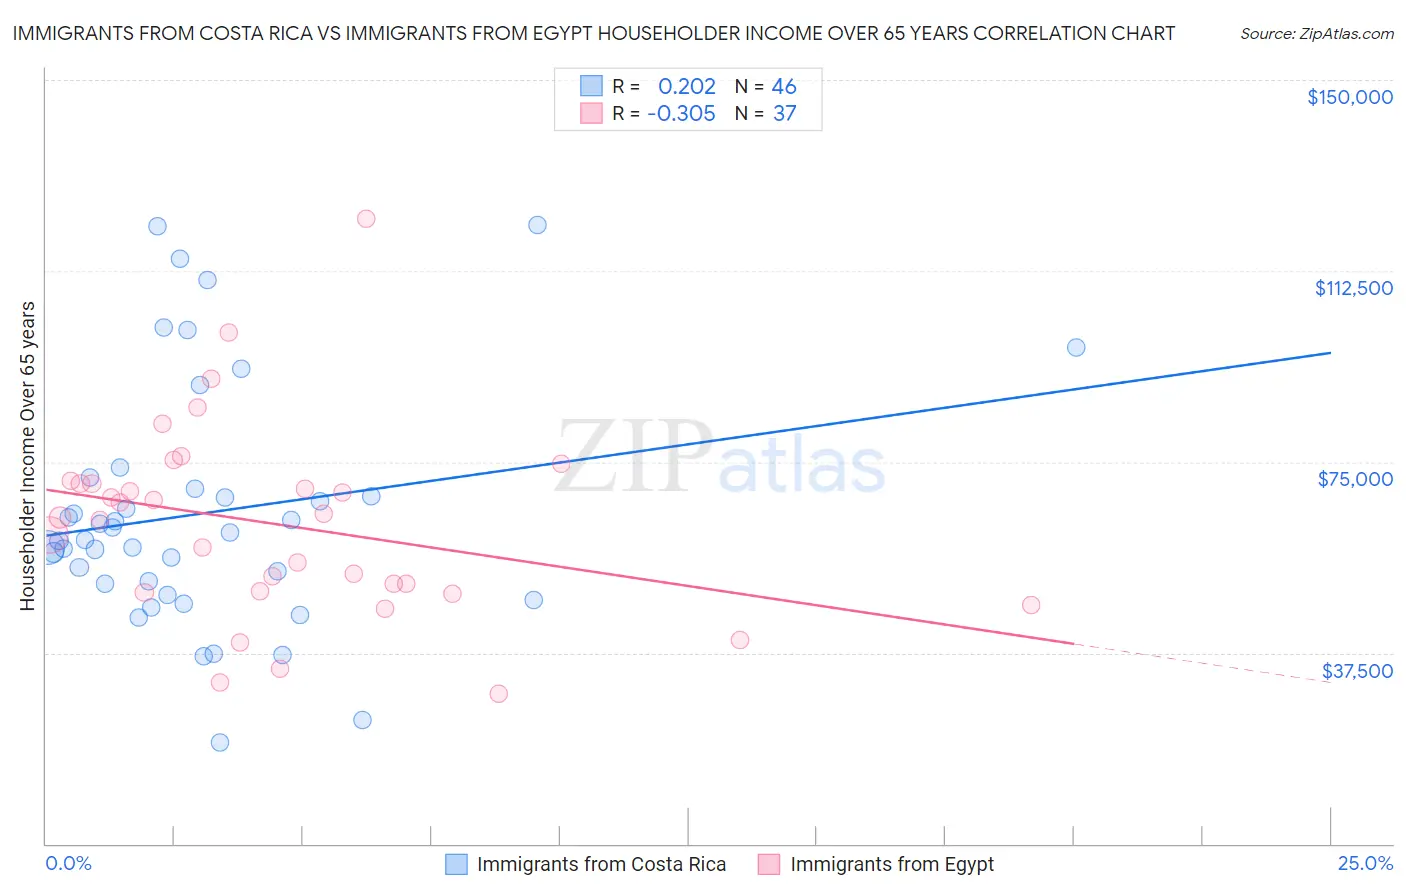
Immigrants from Costa Rica vs Immigrants from Egypt Householder Income Over 65 years Correlation Chart
The statistical analysis conducted on geographies consisting of 204,055,997 people shows a weak positive correlation between the proportion of Immigrants from Costa Rica and household income with householder over the age of 65 in the United States with a correlation coefficient (R) of 0.202 and weighted average of $59,848. Similarly, the statistical analysis conducted on geographies consisting of 245,155,858 people shows a mild negative correlation between the proportion of Immigrants from Egypt and household income with householder over the age of 65 in the United States with a correlation coefficient (R) of -0.305 and weighted average of $64,299, a difference of 7.4%.
Householder Income Over 65 years Correlation Summary
| Measurement | Immigrants from Costa Rica | Immigrants from Egypt |
| Minimum | $19,809 | $29,535 |
| Maximum | $121,538 | $122,712 |
| Range | $101,729 | $93,177 |
| Mean | $64,970 | $62,777 |
| Median | $60,382 | $64,167 |
| Interquartile 25% (IQ1) | $51,157 | $49,457 |
| Interquartile 75% (IQ3) | $69,698 | $71,003 |
| Interquartile Range (IQR) | $18,541 | $21,547 |
| Standard Deviation (Sample) | $23,728 | $19,130 |
| Standard Deviation (Population) | $23,468 | $18,869 |
Similar Demographics by Householder Income Over 65 years
Demographics Similar to Immigrants from Costa Rica by Householder Income Over 65 years
In terms of householder income over 65 years, the demographic groups most similar to Immigrants from Costa Rica are South American ($59,854, a difference of 0.010%), Immigrants from Africa ($59,837, a difference of 0.020%), Immigrants from Iraq ($59,824, a difference of 0.040%), Belgian ($59,915, a difference of 0.11%), and Puget Sound Salish ($59,934, a difference of 0.14%).
| Demographics | Rating | Rank | Householder Income Over 65 years |
| Slovenes | 31.8 /100 | #186 | Fair $60,241 |
| Immigrants | Thailand | 31.3 /100 | #187 | Fair $60,217 |
| Immigrants | Eritrea | 28.6 /100 | #188 | Fair $60,096 |
| Ghanaians | 27.5 /100 | #189 | Fair $60,043 |
| Puget Sound Salish | 25.3 /100 | #190 | Fair $59,934 |
| Belgians | 24.9 /100 | #191 | Fair $59,915 |
| South Americans | 23.8 /100 | #192 | Fair $59,854 |
| Immigrants | Costa Rica | 23.6 /100 | #193 | Fair $59,848 |
| Immigrants | Africa | 23.4 /100 | #194 | Fair $59,837 |
| Immigrants | Iraq | 23.2 /100 | #195 | Fair $59,824 |
| Germans | 21.5 /100 | #196 | Fair $59,730 |
| Immigrants | Kenya | 21.1 /100 | #197 | Fair $59,710 |
| Moroccans | 20.7 /100 | #198 | Fair $59,683 |
| Immigrants | Immigrants | 20.2 /100 | #199 | Fair $59,656 |
| French | 20.2 /100 | #200 | Fair $59,656 |
Demographics Similar to Immigrants from Egypt by Householder Income Over 65 years
In terms of householder income over 65 years, the demographic groups most similar to Immigrants from Egypt are Immigrants from Latvia ($64,298, a difference of 0.0%), Jordanian ($64,313, a difference of 0.020%), Immigrants from Hungary ($64,277, a difference of 0.030%), Immigrants from Bulgaria ($64,379, a difference of 0.13%), and Sri Lankan ($64,201, a difference of 0.15%).
| Demographics | Rating | Rank | Householder Income Over 65 years |
| Austrians | 97.5 /100 | #87 | Exceptional $64,470 |
| Immigrants | Romania | 97.5 /100 | #88 | Exceptional $64,462 |
| Paraguayans | 97.4 /100 | #89 | Exceptional $64,443 |
| Immigrants | Kuwait | 97.4 /100 | #90 | Exceptional $64,433 |
| Immigrants | Oceania | 97.4 /100 | #91 | Exceptional $64,416 |
| Immigrants | Bulgaria | 97.3 /100 | #92 | Exceptional $64,379 |
| Jordanians | 97.1 /100 | #93 | Exceptional $64,313 |
| Immigrants | Egypt | 97.0 /100 | #94 | Exceptional $64,299 |
| Immigrants | Latvia | 97.0 /100 | #95 | Exceptional $64,298 |
| Immigrants | Hungary | 97.0 /100 | #96 | Exceptional $64,277 |
| Sri Lankans | 96.7 /100 | #97 | Exceptional $64,201 |
| Romanians | 96.5 /100 | #98 | Exceptional $64,142 |
| Assyrians/Chaldeans/Syriacs | 96.4 /100 | #99 | Exceptional $64,108 |
| Immigrants | South Eastern Asia | 96.3 /100 | #100 | Exceptional $64,089 |
| Immigrants | Italy | 96.2 /100 | #101 | Exceptional $64,065 |