Assyrian/Chaldean/Syriac vs Immigrants from Egypt 5th Grade
COMPARE
Assyrian/Chaldean/Syriac
Immigrants from Egypt
5th Grade
5th Grade Comparison
Assyrians/Chaldeans/Syriacs
Immigrants from Egypt
97.0%
5TH GRADE
4.5/ 100
METRIC RATING
228th/ 347
METRIC RANK
97.3%
5TH GRADE
32.9/ 100
METRIC RATING
189th/ 347
METRIC RANK
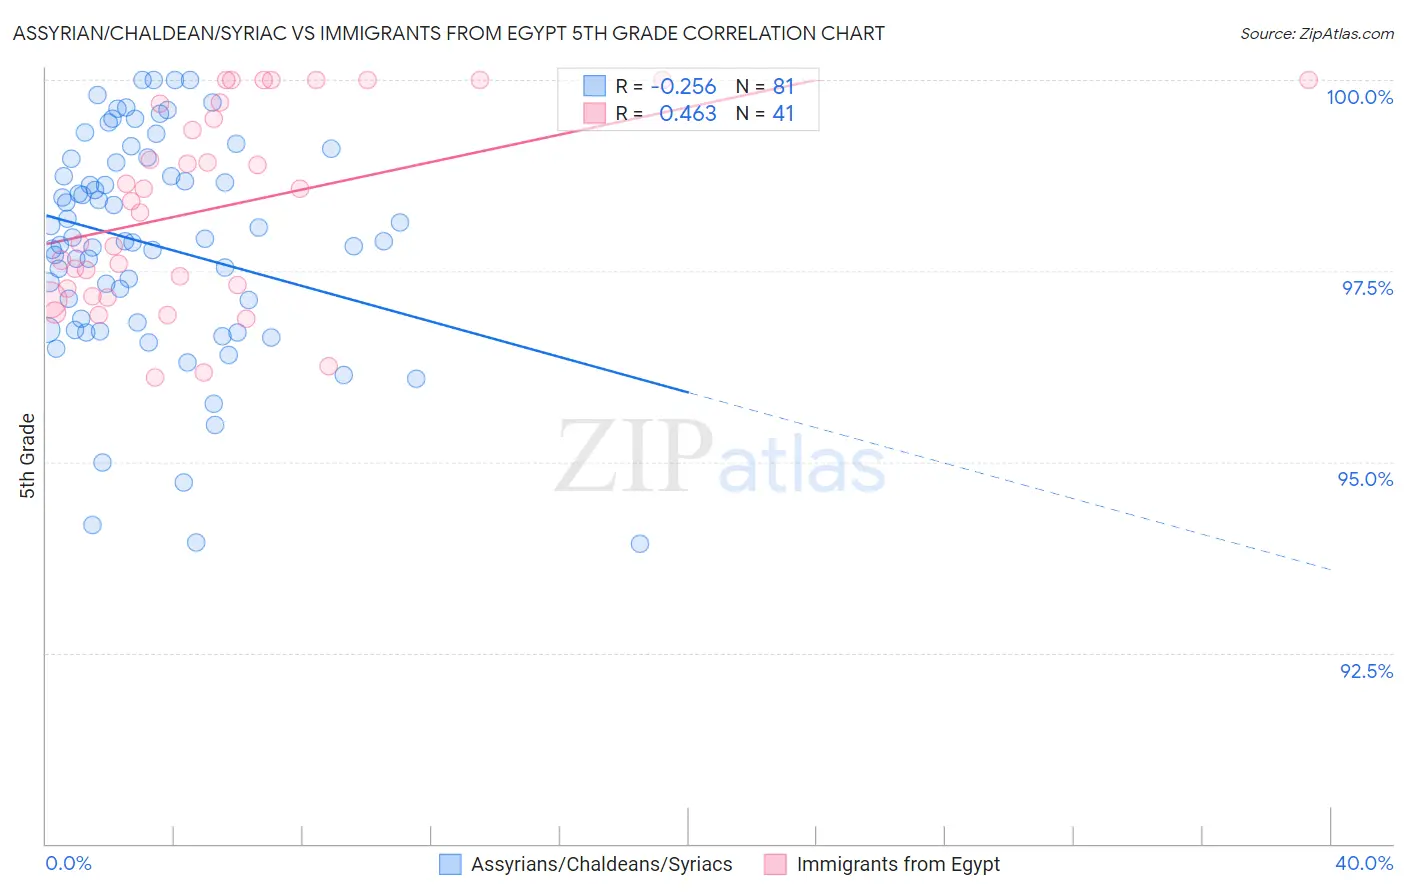
Assyrian/Chaldean/Syriac vs Immigrants from Egypt 5th Grade Correlation Chart
The statistical analysis conducted on geographies consisting of 110,318,304 people shows a weak negative correlation between the proportion of Assyrians/Chaldeans/Syriacs and percentage of population with at least 5th grade education in the United States with a correlation coefficient (R) of -0.256 and weighted average of 97.0%. Similarly, the statistical analysis conducted on geographies consisting of 245,485,794 people shows a moderate positive correlation between the proportion of Immigrants from Egypt and percentage of population with at least 5th grade education in the United States with a correlation coefficient (R) of 0.463 and weighted average of 97.3%, a difference of 0.25%.
5th Grade Correlation Summary
| Measurement | Assyrian/Chaldean/Syriac | Immigrants from Egypt |
| Minimum | 93.9% | 96.1% |
| Maximum | 100.0% | 100.0% |
| Range | 6.1% | 3.9% |
| Mean | 97.8% | 98.3% |
| Median | 97.9% | 98.4% |
| Interquartile 25% (IQ1) | 96.8% | 97.2% |
| Interquartile 75% (IQ3) | 98.9% | 99.7% |
| Interquartile Range (IQR) | 2.2% | 2.5% |
| Standard Deviation (Sample) | 1.4% | 1.3% |
| Standard Deviation (Population) | 1.4% | 1.3% |
Similar Demographics by 5th Grade
Demographics Similar to Assyrians/Chaldeans/Syriacs by 5th Grade
In terms of 5th grade, the demographic groups most similar to Assyrians/Chaldeans/Syriacs are Yuman (97.0%, a difference of 0.0%), Immigrants from Western Asia (97.0%, a difference of 0.0%), Immigrants from Pakistan (97.0%, a difference of 0.010%), Immigrants from Malaysia (97.0%, a difference of 0.010%), and Immigrants from Eastern Asia (97.0%, a difference of 0.010%).
| Demographics | Rating | Rank | 5th Grade |
| Sierra Leoneans | 6.0 /100 | #221 | Tragic 97.1% |
| Immigrants | Panama | 5.7 /100 | #222 | Tragic 97.0% |
| Liberians | 5.7 /100 | #223 | Tragic 97.0% |
| South American Indians | 5.4 /100 | #224 | Tragic 97.0% |
| Bahamians | 5.3 /100 | #225 | Tragic 97.0% |
| Tongans | 5.3 /100 | #226 | Tragic 97.0% |
| Immigrants | Pakistan | 4.7 /100 | #227 | Tragic 97.0% |
| Assyrians/Chaldeans/Syriacs | 4.5 /100 | #228 | Tragic 97.0% |
| Yuman | 4.5 /100 | #229 | Tragic 97.0% |
| Immigrants | Western Asia | 4.3 /100 | #230 | Tragic 97.0% |
| Immigrants | Malaysia | 4.1 /100 | #231 | Tragic 97.0% |
| Immigrants | Eastern Asia | 4.0 /100 | #232 | Tragic 97.0% |
| Sub-Saharan Africans | 3.3 /100 | #233 | Tragic 97.0% |
| Tohono O'odham | 3.2 /100 | #234 | Tragic 97.0% |
| Uruguayans | 3.2 /100 | #235 | Tragic 97.0% |
Demographics Similar to Immigrants from Egypt by 5th Grade
In terms of 5th grade, the demographic groups most similar to Immigrants from Egypt are Paraguayan (97.3%, a difference of 0.0%), Immigrants from Argentina (97.3%, a difference of 0.010%), Spanish American (97.3%, a difference of 0.010%), Black/African American (97.3%, a difference of 0.010%), and Immigrants from Brazil (97.3%, a difference of 0.010%).
| Demographics | Rating | Rank | 5th Grade |
| Mongolians | 39.4 /100 | #182 | Fair 97.3% |
| Immigrants | Ukraine | 38.6 /100 | #183 | Fair 97.3% |
| Immigrants | Venezuela | 38.4 /100 | #184 | Fair 97.3% |
| Dutch West Indians | 36.2 /100 | #185 | Fair 97.3% |
| Immigrants | Argentina | 36.1 /100 | #186 | Fair 97.3% |
| Spanish Americans | 34.7 /100 | #187 | Fair 97.3% |
| Paraguayans | 33.7 /100 | #188 | Fair 97.3% |
| Immigrants | Egypt | 32.9 /100 | #189 | Fair 97.3% |
| Blacks/African Americans | 31.8 /100 | #190 | Fair 97.3% |
| Immigrants | Brazil | 31.5 /100 | #191 | Fair 97.3% |
| Panamanians | 31.3 /100 | #192 | Fair 97.3% |
| Navajo | 29.0 /100 | #193 | Fair 97.2% |
| Immigrants | Albania | 28.5 /100 | #194 | Fair 97.2% |
| Guamanians/Chamorros | 26.8 /100 | #195 | Fair 97.2% |
| Hawaiians | 25.6 /100 | #196 | Fair 97.2% |