Immigrants from Nicaragua vs Immigrants from Egypt Householder Income Over 65 years
COMPARE
Immigrants from Nicaragua
Immigrants from Egypt
Householder Income Over 65 years
Householder Income Over 65 years Comparison
Immigrants from Nicaragua
Immigrants from Egypt
$52,085
HOUSEHOLDER INCOME OVER 65 YEARS
0.0/ 100
METRIC RATING
313th/ 347
METRIC RANK
$64,299
HOUSEHOLDER INCOME OVER 65 YEARS
97.0/ 100
METRIC RATING
94th/ 347
METRIC RANK
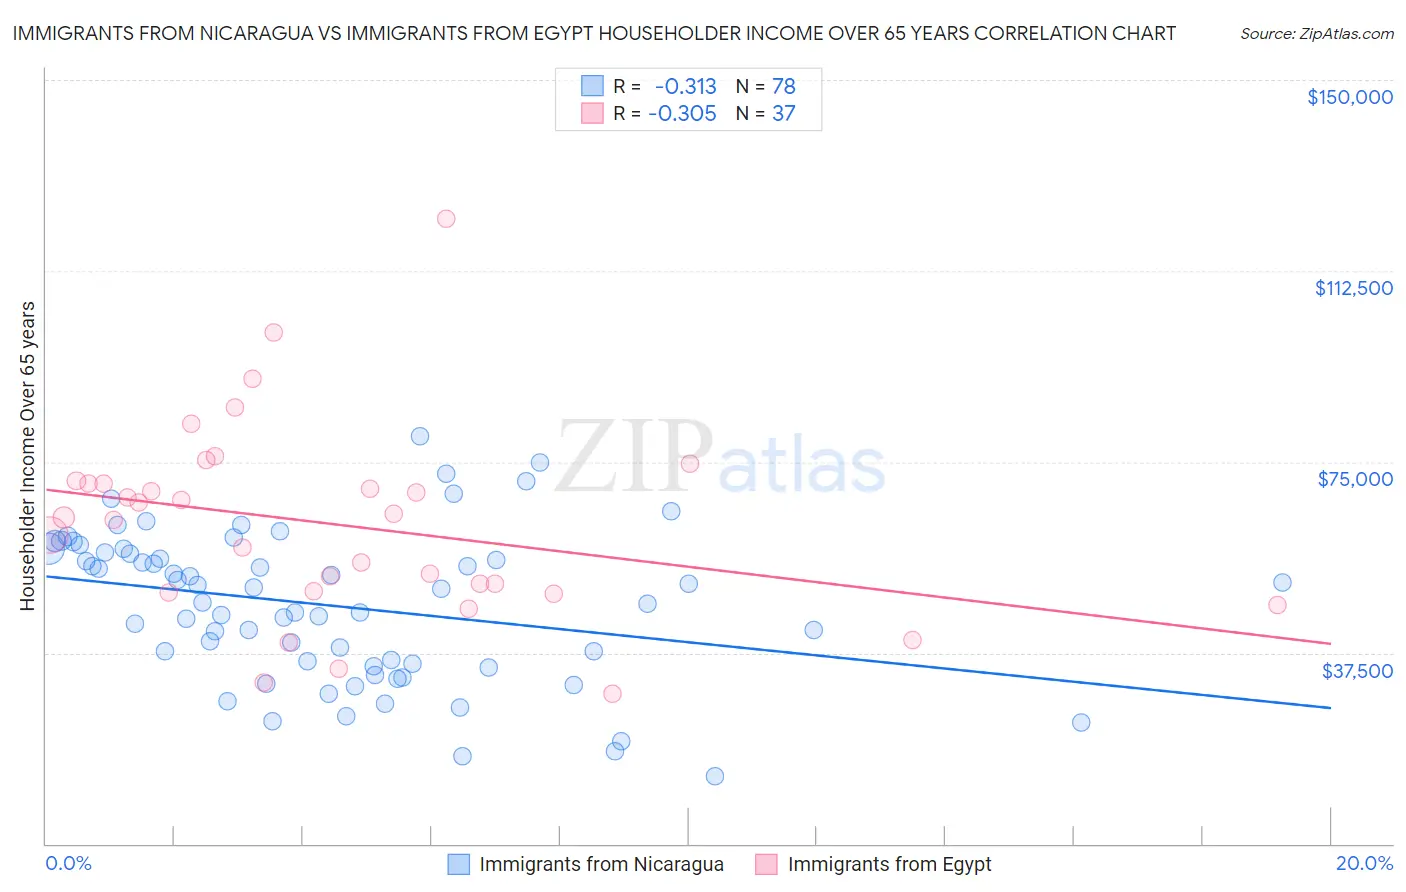
Immigrants from Nicaragua vs Immigrants from Egypt Householder Income Over 65 years Correlation Chart
The statistical analysis conducted on geographies consisting of 236,036,400 people shows a mild negative correlation between the proportion of Immigrants from Nicaragua and household income with householder over the age of 65 in the United States with a correlation coefficient (R) of -0.313 and weighted average of $52,085. Similarly, the statistical analysis conducted on geographies consisting of 245,155,858 people shows a mild negative correlation between the proportion of Immigrants from Egypt and household income with householder over the age of 65 in the United States with a correlation coefficient (R) of -0.305 and weighted average of $64,299, a difference of 23.4%.
Householder Income Over 65 years Correlation Summary
| Measurement | Immigrants from Nicaragua | Immigrants from Egypt |
| Minimum | $13,371 | $29,535 |
| Maximum | $80,000 | $122,712 |
| Range | $66,629 | $93,177 |
| Mean | $46,721 | $62,777 |
| Median | $48,735 | $64,167 |
| Interquartile 25% (IQ1) | $35,431 | $49,457 |
| Interquartile 75% (IQ3) | $57,245 | $71,003 |
| Interquartile Range (IQR) | $21,814 | $21,547 |
| Standard Deviation (Sample) | $14,647 | $19,130 |
| Standard Deviation (Population) | $14,553 | $18,869 |
Similar Demographics by Householder Income Over 65 years
Demographics Similar to Immigrants from Nicaragua by Householder Income Over 65 years
In terms of householder income over 65 years, the demographic groups most similar to Immigrants from Nicaragua are Native/Alaskan ($52,081, a difference of 0.010%), U.S. Virgin Islander ($52,072, a difference of 0.020%), Immigrants from the Azores ($52,121, a difference of 0.070%), Creek ($51,949, a difference of 0.26%), and Immigrants from St. Vincent and the Grenadines ($51,922, a difference of 0.31%).
| Demographics | Rating | Rank | Householder Income Over 65 years |
| Pennsylvania Germans | 0.0 /100 | #306 | Tragic $52,888 |
| Hispanics or Latinos | 0.0 /100 | #307 | Tragic $52,832 |
| Immigrants | Mexico | 0.0 /100 | #308 | Tragic $52,801 |
| Hondurans | 0.0 /100 | #309 | Tragic $52,634 |
| Sioux | 0.0 /100 | #310 | Tragic $52,509 |
| Seminole | 0.0 /100 | #311 | Tragic $52,373 |
| Immigrants | Azores | 0.0 /100 | #312 | Tragic $52,121 |
| Immigrants | Nicaragua | 0.0 /100 | #313 | Tragic $52,085 |
| Natives/Alaskans | 0.0 /100 | #314 | Tragic $52,081 |
| U.S. Virgin Islanders | 0.0 /100 | #315 | Tragic $52,072 |
| Creek | 0.0 /100 | #316 | Tragic $51,949 |
| Immigrants | St. Vincent and the Grenadines | 0.0 /100 | #317 | Tragic $51,922 |
| Haitians | 0.0 /100 | #318 | Tragic $51,912 |
| Immigrants | Honduras | 0.0 /100 | #319 | Tragic $51,888 |
| Colville | 0.0 /100 | #320 | Tragic $51,739 |
Demographics Similar to Immigrants from Egypt by Householder Income Over 65 years
In terms of householder income over 65 years, the demographic groups most similar to Immigrants from Egypt are Immigrants from Latvia ($64,298, a difference of 0.0%), Jordanian ($64,313, a difference of 0.020%), Immigrants from Hungary ($64,277, a difference of 0.030%), Immigrants from Bulgaria ($64,379, a difference of 0.13%), and Sri Lankan ($64,201, a difference of 0.15%).
| Demographics | Rating | Rank | Householder Income Over 65 years |
| Austrians | 97.5 /100 | #87 | Exceptional $64,470 |
| Immigrants | Romania | 97.5 /100 | #88 | Exceptional $64,462 |
| Paraguayans | 97.4 /100 | #89 | Exceptional $64,443 |
| Immigrants | Kuwait | 97.4 /100 | #90 | Exceptional $64,433 |
| Immigrants | Oceania | 97.4 /100 | #91 | Exceptional $64,416 |
| Immigrants | Bulgaria | 97.3 /100 | #92 | Exceptional $64,379 |
| Jordanians | 97.1 /100 | #93 | Exceptional $64,313 |
| Immigrants | Egypt | 97.0 /100 | #94 | Exceptional $64,299 |
| Immigrants | Latvia | 97.0 /100 | #95 | Exceptional $64,298 |
| Immigrants | Hungary | 97.0 /100 | #96 | Exceptional $64,277 |
| Sri Lankans | 96.7 /100 | #97 | Exceptional $64,201 |
| Romanians | 96.5 /100 | #98 | Exceptional $64,142 |
| Assyrians/Chaldeans/Syriacs | 96.4 /100 | #99 | Exceptional $64,108 |
| Immigrants | South Eastern Asia | 96.3 /100 | #100 | Exceptional $64,089 |
| Immigrants | Italy | 96.2 /100 | #101 | Exceptional $64,065 |