Asian vs Immigrants from Nicaragua Median Male Earnings
COMPARE
Asian
Immigrants from Nicaragua
Median Male Earnings
Median Male Earnings Comparison
Asians
Immigrants from Nicaragua
$63,827
MEDIAN MALE EARNINGS
100.0/ 100
METRIC RATING
29th/ 347
METRIC RANK
$47,482
MEDIAN MALE EARNINGS
0.1/ 100
METRIC RATING
294th/ 347
METRIC RANK
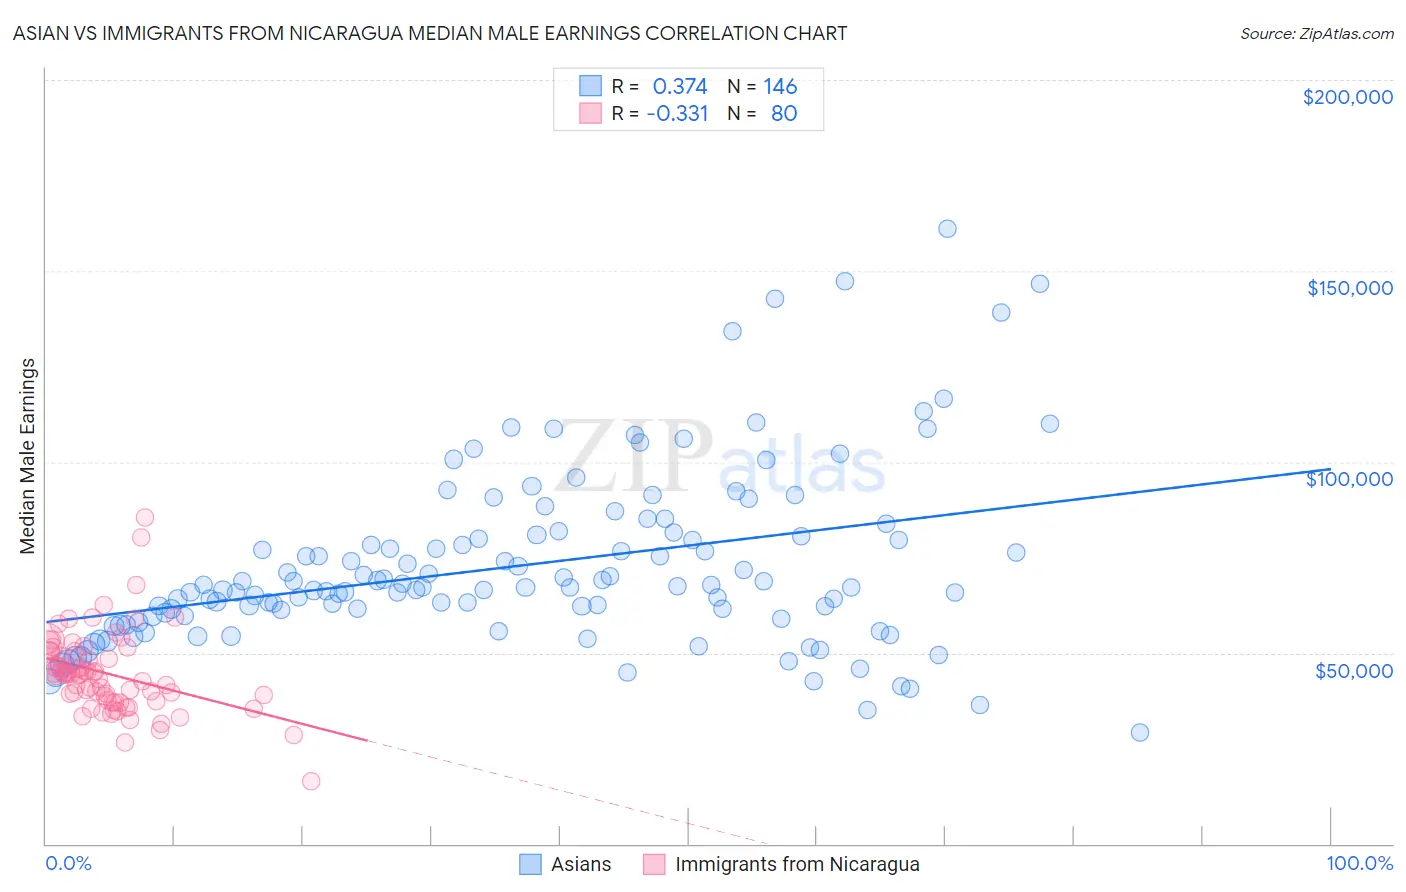
Asian vs Immigrants from Nicaragua Median Male Earnings Correlation Chart
The statistical analysis conducted on geographies consisting of 550,236,506 people shows a mild positive correlation between the proportion of Asians and median male earnings in the United States with a correlation coefficient (R) of 0.374 and weighted average of $63,827. Similarly, the statistical analysis conducted on geographies consisting of 236,305,617 people shows a mild negative correlation between the proportion of Immigrants from Nicaragua and median male earnings in the United States with a correlation coefficient (R) of -0.331 and weighted average of $47,482, a difference of 34.4%.
Median Male Earnings Correlation Summary
| Measurement | Asian | Immigrants from Nicaragua |
| Minimum | $29,236 | $16,250 |
| Maximum | $160,917 | $85,319 |
| Range | $131,681 | $69,069 |
| Mean | $72,799 | $44,541 |
| Median | $67,194 | $44,356 |
| Interquartile 25% (IQ1) | $59,553 | $37,535 |
| Interquartile 75% (IQ3) | $80,527 | $50,283 |
| Interquartile Range (IQR) | $20,975 | $12,748 |
| Standard Deviation (Sample) | $23,189 | $10,745 |
| Standard Deviation (Population) | $23,109 | $10,678 |
Similar Demographics by Median Male Earnings
Demographics Similar to Asians by Median Male Earnings
In terms of median male earnings, the demographic groups most similar to Asians are Russian ($63,939, a difference of 0.17%), Immigrants from Switzerland ($63,944, a difference of 0.18%), Immigrants from France ($63,715, a difference of 0.18%), Latvian ($63,498, a difference of 0.52%), and Turkish ($64,253, a difference of 0.67%).
| Demographics | Rating | Rank | Median Male Earnings |
| Burmese | 100.0 /100 | #22 | Exceptional $65,236 |
| Immigrants | Korea | 100.0 /100 | #23 | Exceptional $65,079 |
| Immigrants | Northern Europe | 100.0 /100 | #24 | Exceptional $64,987 |
| Immigrants | Denmark | 100.0 /100 | #25 | Exceptional $64,625 |
| Turks | 100.0 /100 | #26 | Exceptional $64,253 |
| Immigrants | Switzerland | 100.0 /100 | #27 | Exceptional $63,944 |
| Russians | 100.0 /100 | #28 | Exceptional $63,939 |
| Asians | 100.0 /100 | #29 | Exceptional $63,827 |
| Immigrants | France | 100.0 /100 | #30 | Exceptional $63,715 |
| Latvians | 100.0 /100 | #31 | Exceptional $63,498 |
| Soviet Union | 100.0 /100 | #32 | Exceptional $63,382 |
| Immigrants | Lithuania | 100.0 /100 | #33 | Exceptional $63,346 |
| Immigrants | Russia | 100.0 /100 | #34 | Exceptional $63,326 |
| Immigrants | Asia | 100.0 /100 | #35 | Exceptional $63,240 |
| Israelis | 100.0 /100 | #36 | Exceptional $63,228 |
Demographics Similar to Immigrants from Nicaragua by Median Male Earnings
In terms of median male earnings, the demographic groups most similar to Immigrants from Nicaragua are Indonesian ($47,503, a difference of 0.040%), Central American Indian ($47,433, a difference of 0.10%), Immigrants from Dominica ($47,651, a difference of 0.36%), Inupiat ($47,281, a difference of 0.43%), and Choctaw ($47,729, a difference of 0.52%).
| Demographics | Rating | Rank | Median Male Earnings |
| Immigrants | El Salvador | 0.2 /100 | #287 | Tragic $47,973 |
| Shoshone | 0.2 /100 | #288 | Tragic $47,930 |
| Chickasaw | 0.1 /100 | #289 | Tragic $47,832 |
| Immigrants | Belize | 0.1 /100 | #290 | Tragic $47,809 |
| Choctaw | 0.1 /100 | #291 | Tragic $47,729 |
| Immigrants | Dominica | 0.1 /100 | #292 | Tragic $47,651 |
| Indonesians | 0.1 /100 | #293 | Tragic $47,503 |
| Immigrants | Nicaragua | 0.1 /100 | #294 | Tragic $47,482 |
| Central American Indians | 0.1 /100 | #295 | Tragic $47,433 |
| Inupiat | 0.1 /100 | #296 | Tragic $47,281 |
| Dominicans | 0.1 /100 | #297 | Tragic $47,204 |
| Immigrants | Micronesia | 0.1 /100 | #298 | Tragic $47,177 |
| Immigrants | Zaire | 0.1 /100 | #299 | Tragic $47,070 |
| U.S. Virgin Islanders | 0.1 /100 | #300 | Tragic $47,066 |
| Immigrants | Latin America | 0.1 /100 | #301 | Tragic $46,941 |