Asian vs Immigrants from Western Europe Median Male Earnings
COMPARE
Asian
Immigrants from Western Europe
Median Male Earnings
Median Male Earnings Comparison
Asians
Immigrants from Western Europe
$63,827
MEDIAN MALE EARNINGS
100.0/ 100
METRIC RATING
29th/ 347
METRIC RANK
$60,334
MEDIAN MALE EARNINGS
99.7/ 100
METRIC RATING
72nd/ 347
METRIC RANK
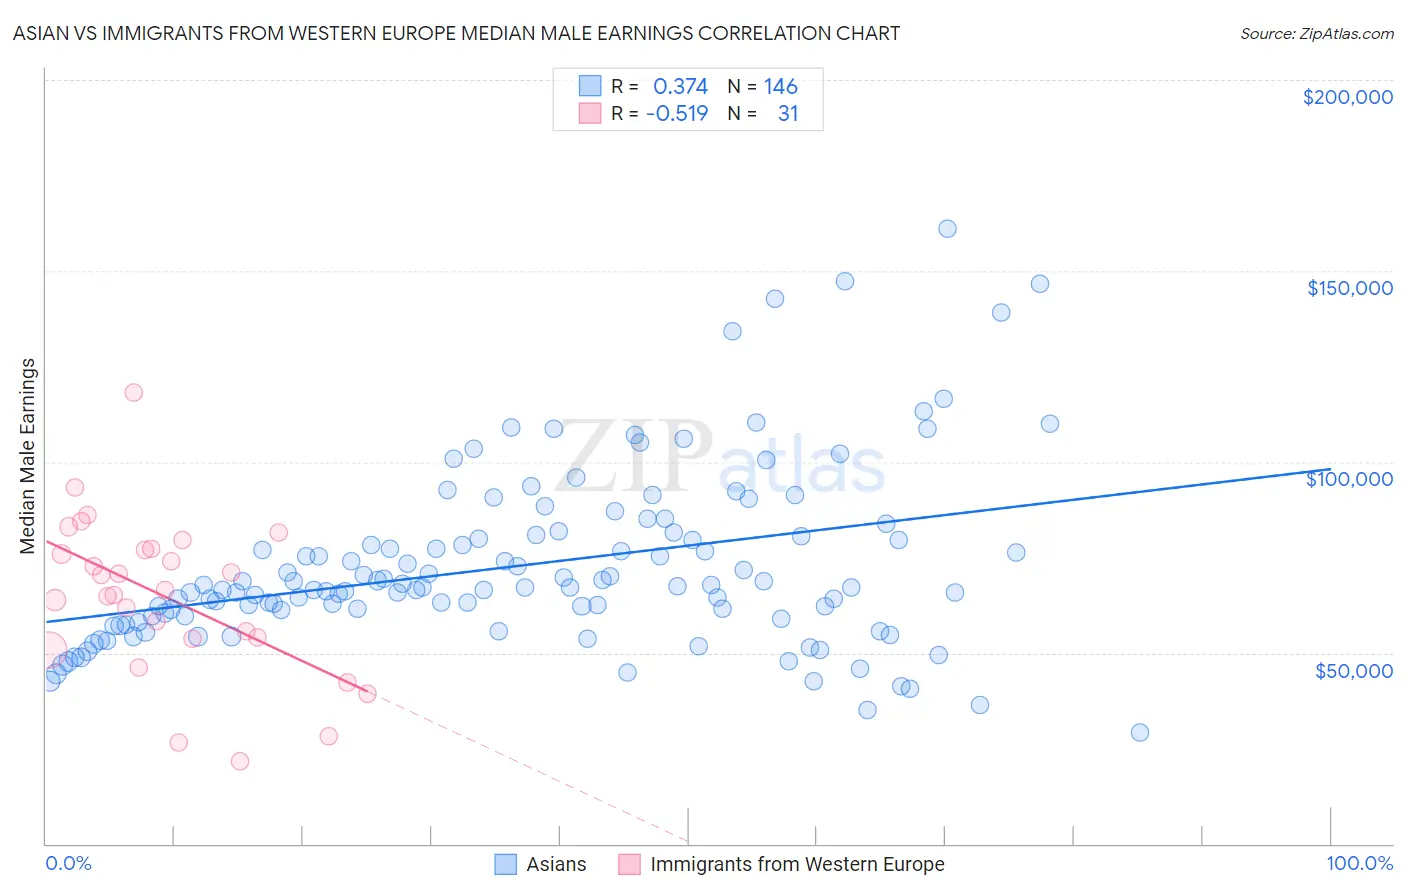
Asian vs Immigrants from Western Europe Median Male Earnings Correlation Chart
The statistical analysis conducted on geographies consisting of 550,236,506 people shows a mild positive correlation between the proportion of Asians and median male earnings in the United States with a correlation coefficient (R) of 0.374 and weighted average of $63,827. Similarly, the statistical analysis conducted on geographies consisting of 493,675,126 people shows a substantial negative correlation between the proportion of Immigrants from Western Europe and median male earnings in the United States with a correlation coefficient (R) of -0.519 and weighted average of $60,334, a difference of 5.8%.
Median Male Earnings Correlation Summary
| Measurement | Asian | Immigrants from Western Europe |
| Minimum | $29,236 | $21,715 |
| Maximum | $160,917 | $118,110 |
| Range | $131,681 | $96,395 |
| Mean | $72,799 | $64,948 |
| Median | $67,194 | $66,494 |
| Interquartile 25% (IQ1) | $59,553 | $53,531 |
| Interquartile 75% (IQ3) | $80,527 | $77,220 |
| Interquartile Range (IQR) | $20,975 | $23,689 |
| Standard Deviation (Sample) | $23,189 | $20,607 |
| Standard Deviation (Population) | $23,109 | $20,272 |
Similar Demographics by Median Male Earnings
Demographics Similar to Asians by Median Male Earnings
In terms of median male earnings, the demographic groups most similar to Asians are Russian ($63,939, a difference of 0.17%), Immigrants from Switzerland ($63,944, a difference of 0.18%), Immigrants from France ($63,715, a difference of 0.18%), Latvian ($63,498, a difference of 0.52%), and Turkish ($64,253, a difference of 0.67%).
| Demographics | Rating | Rank | Median Male Earnings |
| Burmese | 100.0 /100 | #22 | Exceptional $65,236 |
| Immigrants | Korea | 100.0 /100 | #23 | Exceptional $65,079 |
| Immigrants | Northern Europe | 100.0 /100 | #24 | Exceptional $64,987 |
| Immigrants | Denmark | 100.0 /100 | #25 | Exceptional $64,625 |
| Turks | 100.0 /100 | #26 | Exceptional $64,253 |
| Immigrants | Switzerland | 100.0 /100 | #27 | Exceptional $63,944 |
| Russians | 100.0 /100 | #28 | Exceptional $63,939 |
| Asians | 100.0 /100 | #29 | Exceptional $63,827 |
| Immigrants | France | 100.0 /100 | #30 | Exceptional $63,715 |
| Latvians | 100.0 /100 | #31 | Exceptional $63,498 |
| Soviet Union | 100.0 /100 | #32 | Exceptional $63,382 |
| Immigrants | Lithuania | 100.0 /100 | #33 | Exceptional $63,346 |
| Immigrants | Russia | 100.0 /100 | #34 | Exceptional $63,326 |
| Immigrants | Asia | 100.0 /100 | #35 | Exceptional $63,240 |
| Israelis | 100.0 /100 | #36 | Exceptional $63,228 |
Demographics Similar to Immigrants from Western Europe by Median Male Earnings
In terms of median male earnings, the demographic groups most similar to Immigrants from Western Europe are Mongolian ($60,350, a difference of 0.030%), Immigrants from Bulgaria ($60,358, a difference of 0.040%), Immigrants from Canada ($60,388, a difference of 0.090%), Immigrants from North America ($60,265, a difference of 0.12%), and Argentinean ($60,117, a difference of 0.36%).
| Demographics | Rating | Rank | Median Male Earnings |
| Immigrants | Indonesia | 99.8 /100 | #65 | Exceptional $60,935 |
| Immigrants | Croatia | 99.8 /100 | #66 | Exceptional $60,914 |
| Immigrants | Spain | 99.8 /100 | #67 | Exceptional $60,750 |
| Immigrants | Serbia | 99.7 /100 | #68 | Exceptional $60,600 |
| Immigrants | Canada | 99.7 /100 | #69 | Exceptional $60,388 |
| Immigrants | Bulgaria | 99.7 /100 | #70 | Exceptional $60,358 |
| Mongolians | 99.7 /100 | #71 | Exceptional $60,350 |
| Immigrants | Western Europe | 99.7 /100 | #72 | Exceptional $60,334 |
| Immigrants | North America | 99.7 /100 | #73 | Exceptional $60,265 |
| Argentineans | 99.6 /100 | #74 | Exceptional $60,117 |
| Immigrants | Bolivia | 99.6 /100 | #75 | Exceptional $60,088 |
| Romanians | 99.6 /100 | #76 | Exceptional $60,063 |
| Paraguayans | 99.5 /100 | #77 | Exceptional $59,975 |
| Immigrants | Egypt | 99.5 /100 | #78 | Exceptional $59,925 |
| Immigrants | Ukraine | 99.5 /100 | #79 | Exceptional $59,820 |