Asian vs Immigrants from Sri Lanka Median Male Earnings
COMPARE
Asian
Immigrants from Sri Lanka
Median Male Earnings
Median Male Earnings Comparison
Asians
Immigrants from Sri Lanka
$63,827
MEDIAN MALE EARNINGS
100.0/ 100
METRIC RATING
29th/ 347
METRIC RANK
$63,099
MEDIAN MALE EARNINGS
100.0/ 100
METRIC RATING
37th/ 347
METRIC RANK
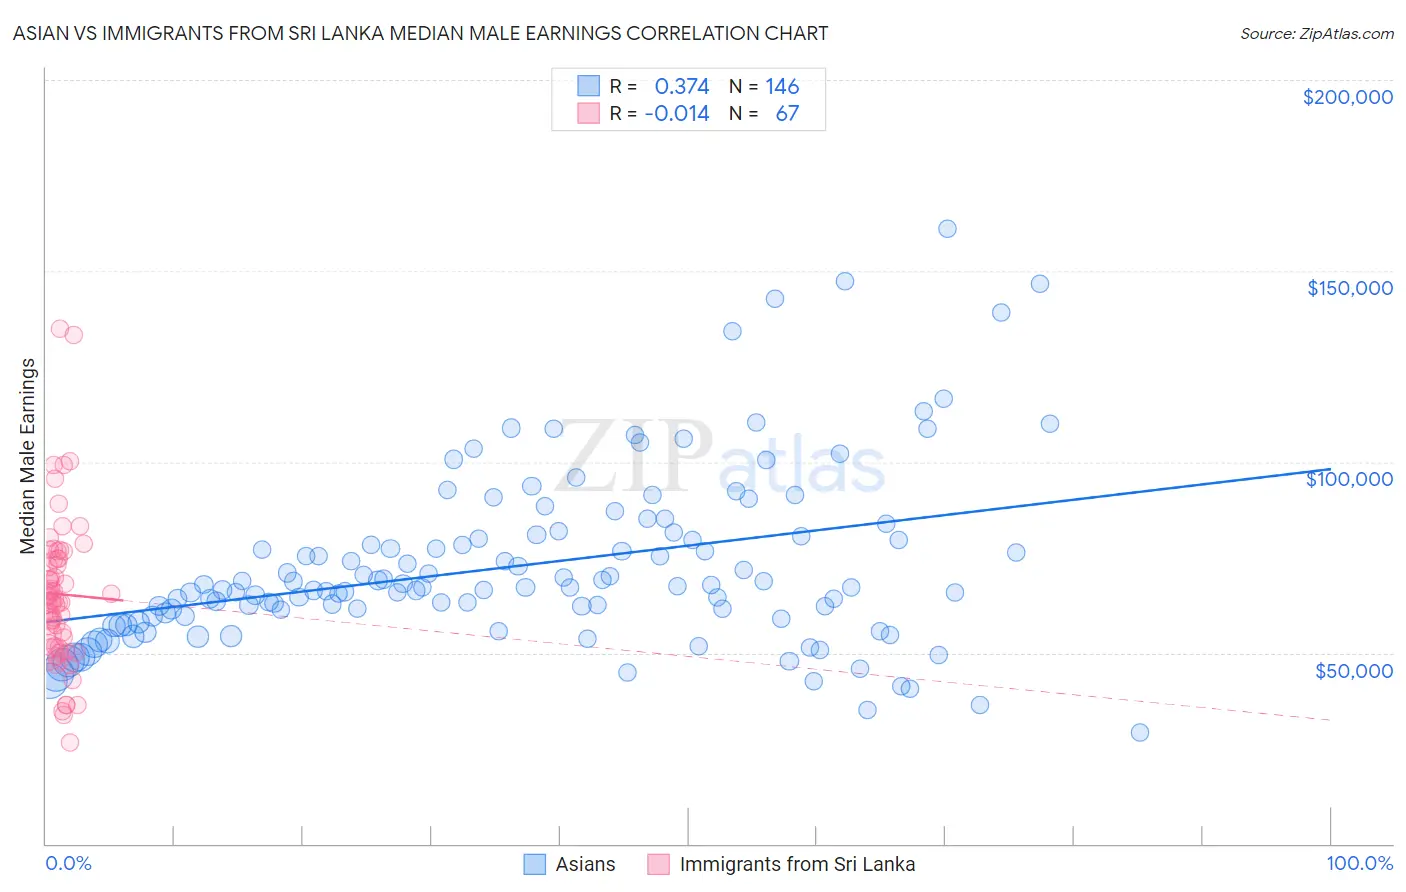
Asian vs Immigrants from Sri Lanka Median Male Earnings Correlation Chart
The statistical analysis conducted on geographies consisting of 550,236,506 people shows a mild positive correlation between the proportion of Asians and median male earnings in the United States with a correlation coefficient (R) of 0.374 and weighted average of $63,827. Similarly, the statistical analysis conducted on geographies consisting of 149,678,305 people shows no correlation between the proportion of Immigrants from Sri Lanka and median male earnings in the United States with a correlation coefficient (R) of -0.014 and weighted average of $63,099, a difference of 1.1%.
Median Male Earnings Correlation Summary
| Measurement | Asian | Immigrants from Sri Lanka |
| Minimum | $29,236 | $26,357 |
| Maximum | $160,917 | $134,837 |
| Range | $131,681 | $108,480 |
| Mean | $72,799 | $65,375 |
| Median | $67,194 | $63,858 |
| Interquartile 25% (IQ1) | $59,553 | $51,338 |
| Interquartile 75% (IQ3) | $80,527 | $74,628 |
| Interquartile Range (IQR) | $20,975 | $23,290 |
| Standard Deviation (Sample) | $23,189 | $20,034 |
| Standard Deviation (Population) | $23,109 | $19,884 |
Demographics Similar to Asians and Immigrants from Sri Lanka by Median Male Earnings
In terms of median male earnings, the demographic groups most similar to Asians are Russian ($63,939, a difference of 0.17%), Immigrants from Switzerland ($63,944, a difference of 0.18%), Immigrants from France ($63,715, a difference of 0.18%), Latvian ($63,498, a difference of 0.52%), and Turkish ($64,253, a difference of 0.67%). Similarly, the demographic groups most similar to Immigrants from Sri Lanka are Israeli ($63,228, a difference of 0.20%), Immigrants from Asia ($63,240, a difference of 0.22%), Maltese ($62,953, a difference of 0.23%), Immigrants from South Africa ($62,899, a difference of 0.32%), and Immigrants from Russia ($63,326, a difference of 0.36%).
| Demographics | Rating | Rank | Median Male Earnings |
| Immigrants | Korea | 100.0 /100 | #23 | Exceptional $65,079 |
| Immigrants | Northern Europe | 100.0 /100 | #24 | Exceptional $64,987 |
| Immigrants | Denmark | 100.0 /100 | #25 | Exceptional $64,625 |
| Turks | 100.0 /100 | #26 | Exceptional $64,253 |
| Immigrants | Switzerland | 100.0 /100 | #27 | Exceptional $63,944 |
| Russians | 100.0 /100 | #28 | Exceptional $63,939 |
| Asians | 100.0 /100 | #29 | Exceptional $63,827 |
| Immigrants | France | 100.0 /100 | #30 | Exceptional $63,715 |
| Latvians | 100.0 /100 | #31 | Exceptional $63,498 |
| Soviet Union | 100.0 /100 | #32 | Exceptional $63,382 |
| Immigrants | Lithuania | 100.0 /100 | #33 | Exceptional $63,346 |
| Immigrants | Russia | 100.0 /100 | #34 | Exceptional $63,326 |
| Immigrants | Asia | 100.0 /100 | #35 | Exceptional $63,240 |
| Israelis | 100.0 /100 | #36 | Exceptional $63,228 |
| Immigrants | Sri Lanka | 100.0 /100 | #37 | Exceptional $63,099 |
| Maltese | 100.0 /100 | #38 | Exceptional $62,953 |
| Immigrants | South Africa | 100.0 /100 | #39 | Exceptional $62,899 |
| Australians | 100.0 /100 | #40 | Exceptional $62,857 |
| Immigrants | Turkey | 100.0 /100 | #41 | Exceptional $62,728 |
| Immigrants | Greece | 100.0 /100 | #42 | Exceptional $62,689 |
| Immigrants | Belarus | 100.0 /100 | #43 | Exceptional $62,658 |