Asian vs Immigrants from Burma/Myanmar Median Male Earnings
COMPARE
Asian
Immigrants from Burma/Myanmar
Median Male Earnings
Median Male Earnings Comparison
Asians
Immigrants from Burma/Myanmar
$63,827
MEDIAN MALE EARNINGS
100.0/ 100
METRIC RATING
29th/ 347
METRIC RANK
$50,298
MEDIAN MALE EARNINGS
1.6/ 100
METRIC RATING
249th/ 347
METRIC RANK
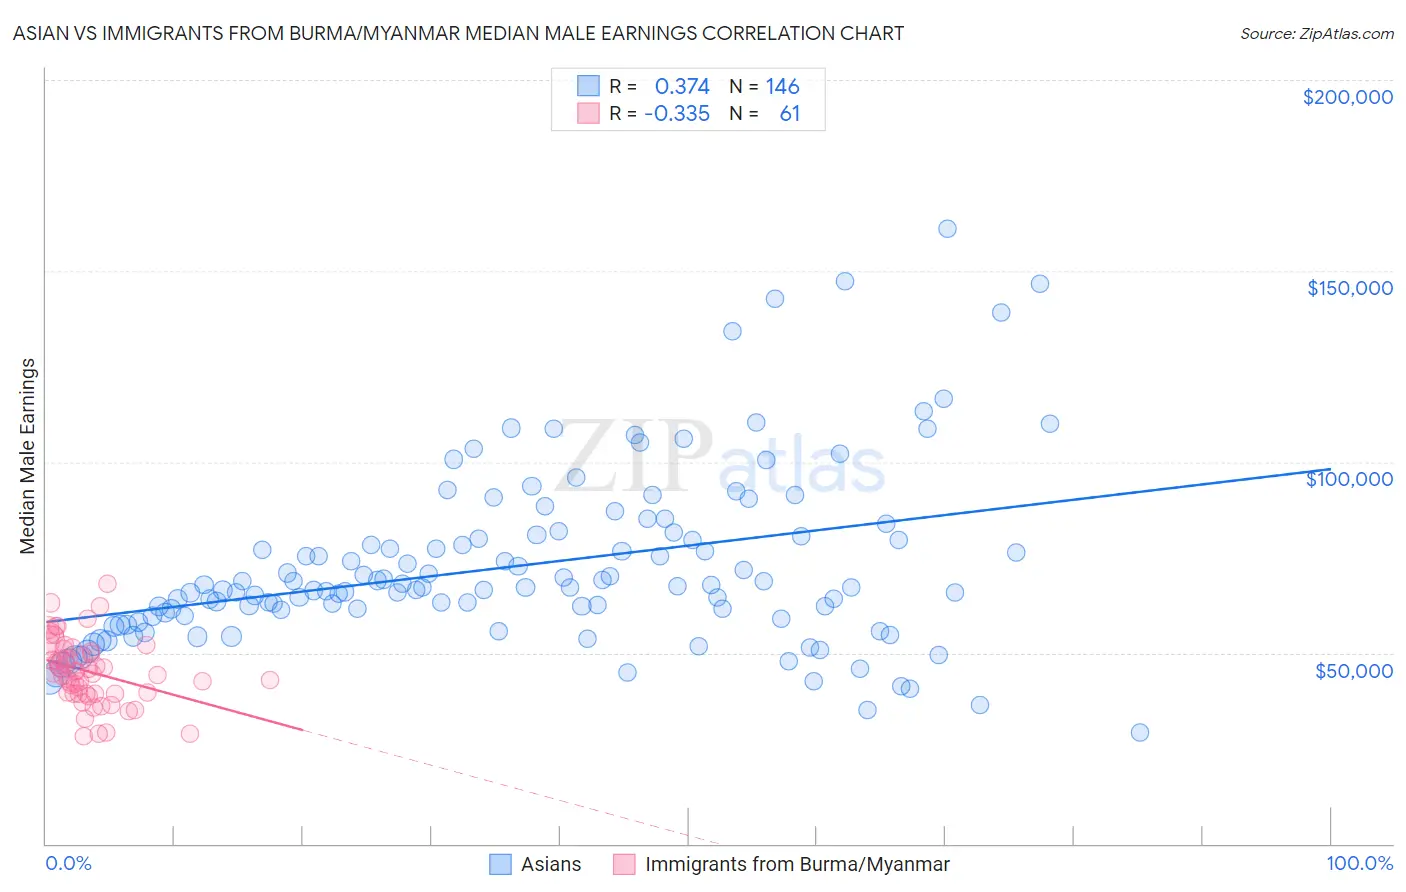
Asian vs Immigrants from Burma/Myanmar Median Male Earnings Correlation Chart
The statistical analysis conducted on geographies consisting of 550,236,506 people shows a mild positive correlation between the proportion of Asians and median male earnings in the United States with a correlation coefficient (R) of 0.374 and weighted average of $63,827. Similarly, the statistical analysis conducted on geographies consisting of 172,350,242 people shows a mild negative correlation between the proportion of Immigrants from Burma/Myanmar and median male earnings in the United States with a correlation coefficient (R) of -0.335 and weighted average of $50,298, a difference of 26.9%.
Median Male Earnings Correlation Summary
| Measurement | Asian | Immigrants from Burma/Myanmar |
| Minimum | $29,236 | $27,990 |
| Maximum | $160,917 | $67,960 |
| Range | $131,681 | $39,970 |
| Mean | $72,799 | $45,043 |
| Median | $67,194 | $44,781 |
| Interquartile 25% (IQ1) | $59,553 | $39,264 |
| Interquartile 75% (IQ3) | $80,527 | $50,701 |
| Interquartile Range (IQR) | $20,975 | $11,437 |
| Standard Deviation (Sample) | $23,189 | $8,603 |
| Standard Deviation (Population) | $23,109 | $8,532 |
Similar Demographics by Median Male Earnings
Demographics Similar to Asians by Median Male Earnings
In terms of median male earnings, the demographic groups most similar to Asians are Russian ($63,939, a difference of 0.17%), Immigrants from Switzerland ($63,944, a difference of 0.18%), Immigrants from France ($63,715, a difference of 0.18%), Latvian ($63,498, a difference of 0.52%), and Turkish ($64,253, a difference of 0.67%).
| Demographics | Rating | Rank | Median Male Earnings |
| Burmese | 100.0 /100 | #22 | Exceptional $65,236 |
| Immigrants | Korea | 100.0 /100 | #23 | Exceptional $65,079 |
| Immigrants | Northern Europe | 100.0 /100 | #24 | Exceptional $64,987 |
| Immigrants | Denmark | 100.0 /100 | #25 | Exceptional $64,625 |
| Turks | 100.0 /100 | #26 | Exceptional $64,253 |
| Immigrants | Switzerland | 100.0 /100 | #27 | Exceptional $63,944 |
| Russians | 100.0 /100 | #28 | Exceptional $63,939 |
| Asians | 100.0 /100 | #29 | Exceptional $63,827 |
| Immigrants | France | 100.0 /100 | #30 | Exceptional $63,715 |
| Latvians | 100.0 /100 | #31 | Exceptional $63,498 |
| Soviet Union | 100.0 /100 | #32 | Exceptional $63,382 |
| Immigrants | Lithuania | 100.0 /100 | #33 | Exceptional $63,346 |
| Immigrants | Russia | 100.0 /100 | #34 | Exceptional $63,326 |
| Immigrants | Asia | 100.0 /100 | #35 | Exceptional $63,240 |
| Israelis | 100.0 /100 | #36 | Exceptional $63,228 |
Demographics Similar to Immigrants from Burma/Myanmar by Median Male Earnings
In terms of median male earnings, the demographic groups most similar to Immigrants from Burma/Myanmar are Osage ($50,292, a difference of 0.010%), Immigrants from Grenada ($50,279, a difference of 0.040%), Immigrants from Guyana ($50,321, a difference of 0.050%), Subsaharan African ($50,408, a difference of 0.22%), and Immigrants from Ecuador ($50,474, a difference of 0.35%).
| Demographics | Rating | Rank | Median Male Earnings |
| Guyanese | 2.2 /100 | #242 | Tragic $50,613 |
| French American Indians | 2.2 /100 | #243 | Tragic $50,611 |
| Houma | 2.0 /100 | #244 | Tragic $50,547 |
| Hawaiians | 1.9 /100 | #245 | Tragic $50,488 |
| Immigrants | Ecuador | 1.9 /100 | #246 | Tragic $50,474 |
| Sub-Saharan Africans | 1.8 /100 | #247 | Tragic $50,408 |
| Immigrants | Guyana | 1.6 /100 | #248 | Tragic $50,321 |
| Immigrants | Burma/Myanmar | 1.6 /100 | #249 | Tragic $50,298 |
| Osage | 1.6 /100 | #250 | Tragic $50,292 |
| Immigrants | Grenada | 1.6 /100 | #251 | Tragic $50,279 |
| Immigrants | Cabo Verde | 1.2 /100 | #252 | Tragic $50,009 |
| German Russians | 1.1 /100 | #253 | Tragic $49,924 |
| Senegalese | 1.0 /100 | #254 | Tragic $49,774 |
| Alaskan Athabascans | 0.9 /100 | #255 | Tragic $49,748 |
| Alaska Natives | 0.9 /100 | #256 | Tragic $49,711 |