Japanese vs Immigrants from Saudi Arabia Median Household Income
COMPARE
Japanese
Immigrants from Saudi Arabia
Median Household Income
Median Household Income Comparison
Japanese
Immigrants from Saudi Arabia
$83,395
MEDIAN HOUSEHOLD INCOME
25.1/ 100
METRIC RATING
198th/ 347
METRIC RANK
$86,875
MEDIAN HOUSEHOLD INCOME
75.8/ 100
METRIC RATING
152nd/ 347
METRIC RANK
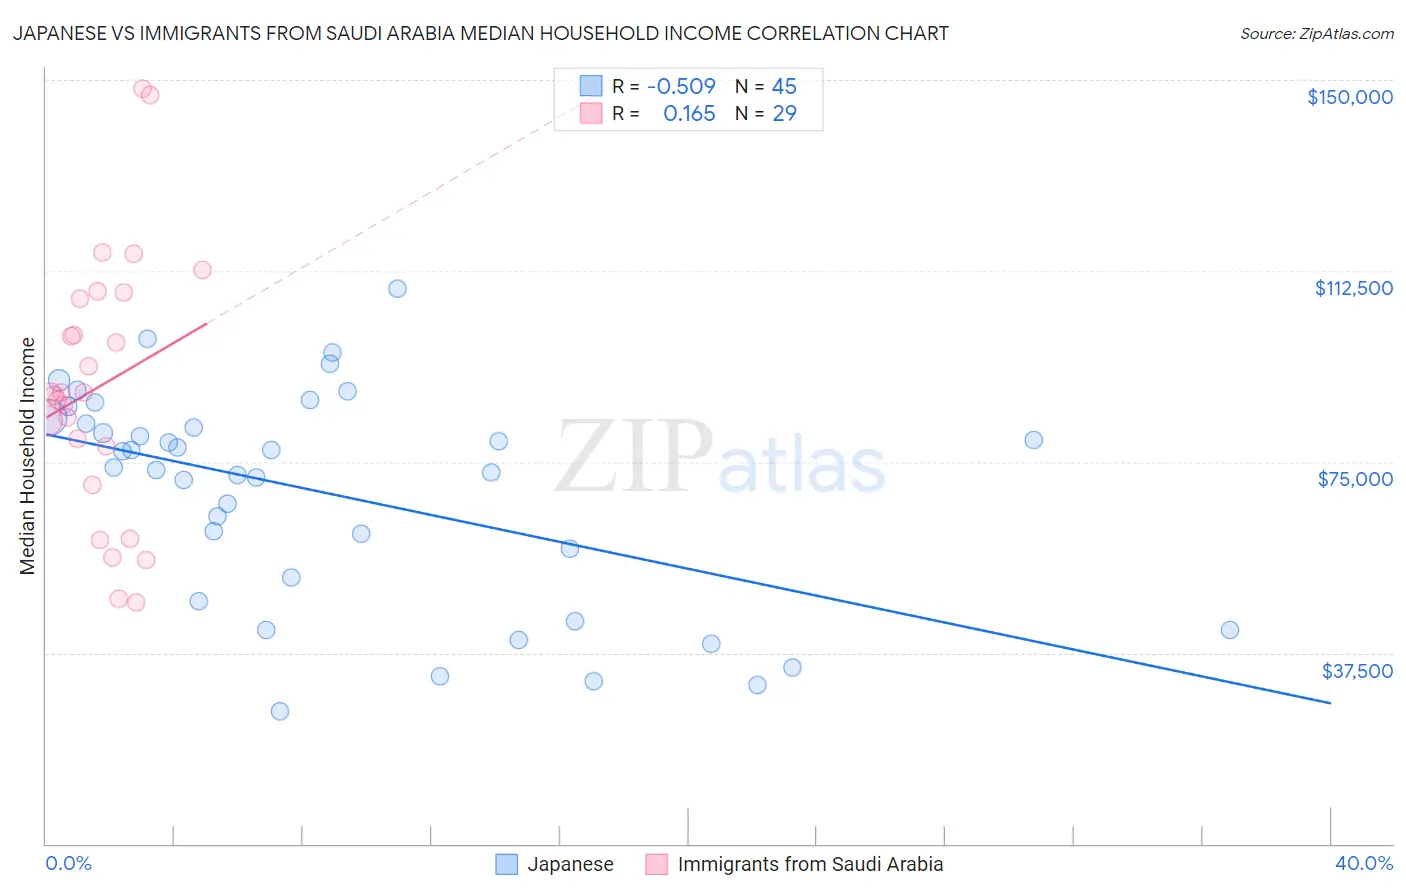
Japanese vs Immigrants from Saudi Arabia Median Household Income Correlation Chart
The statistical analysis conducted on geographies consisting of 249,040,762 people shows a substantial negative correlation between the proportion of Japanese and median household income in the United States with a correlation coefficient (R) of -0.509 and weighted average of $83,395. Similarly, the statistical analysis conducted on geographies consisting of 164,184,047 people shows a poor positive correlation between the proportion of Immigrants from Saudi Arabia and median household income in the United States with a correlation coefficient (R) of 0.165 and weighted average of $86,875, a difference of 4.2%.
Median Household Income Correlation Summary
| Measurement | Japanese | Immigrants from Saudi Arabia |
| Minimum | $25,982 | $47,501 |
| Maximum | $108,958 | $148,227 |
| Range | $82,976 | $100,726 |
| Mean | $68,760 | $89,831 |
| Median | $73,852 | $88,579 |
| Interquartile 25% (IQ1) | $50,038 | $74,250 |
| Interquartile 75% (IQ3) | $83,119 | $107,595 |
| Interquartile Range (IQR) | $33,081 | $33,345 |
| Standard Deviation (Sample) | $21,079 | $25,493 |
| Standard Deviation (Population) | $20,843 | $25,050 |
Similar Demographics by Median Household Income
Demographics Similar to Japanese by Median Household Income
In terms of median household income, the demographic groups most similar to Japanese are German ($83,358, a difference of 0.040%), Aleut ($83,446, a difference of 0.060%), Tsimshian ($83,346, a difference of 0.060%), Spanish ($83,343, a difference of 0.060%), and Immigrants from Thailand ($83,327, a difference of 0.080%).
| Demographics | Rating | Rank | Median Household Income |
| Iraqis | 29.6 /100 | #191 | Fair $83,753 |
| Welsh | 28.0 /100 | #192 | Fair $83,628 |
| Finns | 27.7 /100 | #193 | Fair $83,607 |
| Ghanaians | 27.4 /100 | #194 | Fair $83,582 |
| Immigrants | Armenia | 27.0 /100 | #195 | Fair $83,555 |
| French | 26.0 /100 | #196 | Fair $83,468 |
| Aleuts | 25.7 /100 | #197 | Fair $83,446 |
| Japanese | 25.1 /100 | #198 | Fair $83,395 |
| Germans | 24.6 /100 | #199 | Fair $83,358 |
| Tsimshian | 24.5 /100 | #200 | Fair $83,346 |
| Spanish | 24.4 /100 | #201 | Fair $83,343 |
| Immigrants | Thailand | 24.3 /100 | #202 | Fair $83,327 |
| Immigrants | Cambodia | 24.0 /100 | #203 | Fair $83,304 |
| Immigrants | Africa | 23.8 /100 | #204 | Fair $83,289 |
| Celtics | 22.7 /100 | #205 | Fair $83,193 |
Demographics Similar to Immigrants from Saudi Arabia by Median Household Income
In terms of median household income, the demographic groups most similar to Immigrants from Saudi Arabia are Hungarian ($86,920, a difference of 0.050%), South American ($86,824, a difference of 0.060%), Immigrants from Germany ($86,764, a difference of 0.13%), Basque ($87,001, a difference of 0.15%), and Immigrants from Nepal ($87,046, a difference of 0.20%).
| Demographics | Rating | Rank | Median Household Income |
| Ugandans | 82.9 /100 | #145 | Excellent $87,557 |
| Immigrants | Uganda | 82.8 /100 | #146 | Excellent $87,553 |
| South American Indians | 81.8 /100 | #147 | Excellent $87,446 |
| Costa Ricans | 80.0 /100 | #148 | Excellent $87,262 |
| Immigrants | Nepal | 77.7 /100 | #149 | Good $87,046 |
| Basques | 77.2 /100 | #150 | Good $87,001 |
| Hungarians | 76.3 /100 | #151 | Good $86,920 |
| Immigrants | Saudi Arabia | 75.8 /100 | #152 | Good $86,875 |
| South Americans | 75.1 /100 | #153 | Good $86,824 |
| Immigrants | Germany | 74.4 /100 | #154 | Good $86,764 |
| Carpatho Rusyns | 72.8 /100 | #155 | Good $86,635 |
| Immigrants | Albania | 71.5 /100 | #156 | Good $86,534 |
| Samoans | 71.0 /100 | #157 | Good $86,498 |
| Moroccans | 70.6 /100 | #158 | Good $86,468 |
| Immigrants | Uzbekistan | 70.1 /100 | #159 | Good $86,425 |