Polish vs Immigrants from Saudi Arabia Median Household Income
COMPARE
Polish
Immigrants from Saudi Arabia
Median Household Income
Median Household Income Comparison
Poles
Immigrants from Saudi Arabia
$88,472
MEDIAN HOUSEHOLD INCOME
89.7/ 100
METRIC RATING
136th/ 347
METRIC RANK
$86,875
MEDIAN HOUSEHOLD INCOME
75.8/ 100
METRIC RATING
152nd/ 347
METRIC RANK
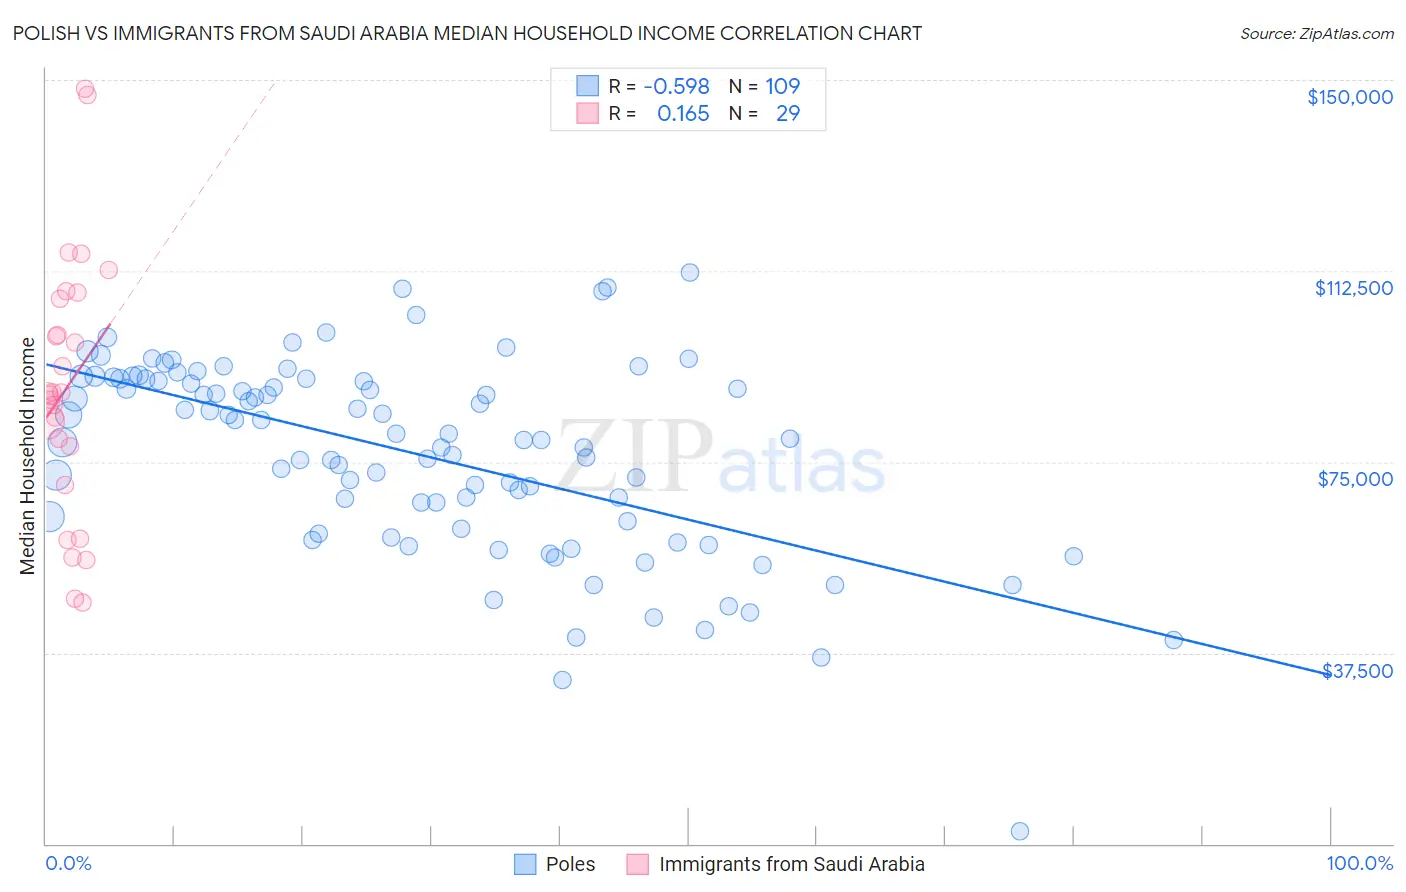
Polish vs Immigrants from Saudi Arabia Median Household Income Correlation Chart
The statistical analysis conducted on geographies consisting of 559,571,407 people shows a substantial negative correlation between the proportion of Poles and median household income in the United States with a correlation coefficient (R) of -0.598 and weighted average of $88,472. Similarly, the statistical analysis conducted on geographies consisting of 164,184,047 people shows a poor positive correlation between the proportion of Immigrants from Saudi Arabia and median household income in the United States with a correlation coefficient (R) of 0.165 and weighted average of $86,875, a difference of 1.8%.
Median Household Income Correlation Summary
| Measurement | Polish | Immigrants from Saudi Arabia |
| Minimum | $2,499 | $47,501 |
| Maximum | $112,083 | $148,227 |
| Range | $109,584 | $100,726 |
| Mean | $76,577 | $89,831 |
| Median | $79,444 | $88,579 |
| Interquartile 25% (IQ1) | $62,696 | $74,250 |
| Interquartile 75% (IQ3) | $91,347 | $107,595 |
| Interquartile Range (IQR) | $28,651 | $33,345 |
| Standard Deviation (Sample) | $19,210 | $25,493 |
| Standard Deviation (Population) | $19,121 | $25,050 |
Demographics Similar to Poles and Immigrants from Saudi Arabia by Median Household Income
In terms of median household income, the demographic groups most similar to Poles are Sierra Leonean ($88,463, a difference of 0.010%), Immigrants from Sierra Leone ($88,498, a difference of 0.030%), Swedish ($88,524, a difference of 0.060%), Arab ($88,398, a difference of 0.080%), and Immigrants from Chile ($88,388, a difference of 0.090%). Similarly, the demographic groups most similar to Immigrants from Saudi Arabia are Hungarian ($86,920, a difference of 0.050%), South American ($86,824, a difference of 0.060%), Immigrants from Germany ($86,764, a difference of 0.13%), Basque ($87,001, a difference of 0.15%), and Immigrants from Nepal ($87,046, a difference of 0.20%).
| Demographics | Rating | Rank | Median Household Income |
| Swedes | 90.0 /100 | #134 | Exceptional $88,524 |
| Immigrants | Sierra Leone | 89.9 /100 | #135 | Excellent $88,498 |
| Poles | 89.7 /100 | #136 | Excellent $88,472 |
| Sierra Leoneans | 89.6 /100 | #137 | Excellent $88,463 |
| Arabs | 89.2 /100 | #138 | Excellent $88,398 |
| Immigrants | Chile | 89.2 /100 | #139 | Excellent $88,388 |
| Lebanese | 87.2 /100 | #140 | Excellent $88,091 |
| Immigrants | Morocco | 86.0 /100 | #141 | Excellent $87,930 |
| Canadians | 84.7 /100 | #142 | Excellent $87,769 |
| Danes | 83.9 /100 | #143 | Excellent $87,676 |
| Serbians | 83.0 /100 | #144 | Excellent $87,572 |
| Ugandans | 82.9 /100 | #145 | Excellent $87,557 |
| Immigrants | Uganda | 82.8 /100 | #146 | Excellent $87,553 |
| South American Indians | 81.8 /100 | #147 | Excellent $87,446 |
| Costa Ricans | 80.0 /100 | #148 | Excellent $87,262 |
| Immigrants | Nepal | 77.7 /100 | #149 | Good $87,046 |
| Basques | 77.2 /100 | #150 | Good $87,001 |
| Hungarians | 76.3 /100 | #151 | Good $86,920 |
| Immigrants | Saudi Arabia | 75.8 /100 | #152 | Good $86,875 |
| South Americans | 75.1 /100 | #153 | Good $86,824 |
| Immigrants | Germany | 74.4 /100 | #154 | Good $86,764 |