Asian vs Immigrants from Northern Europe Female Disability
COMPARE
Asian
Immigrants from Northern Europe
Female Disability
Female Disability Comparison
Asians
Immigrants from Northern Europe
10.9%
FEMALE DISABILITY
100.0/ 100
METRIC RATING
21st/ 347
METRIC RANK
11.6%
FEMALE DISABILITY
99.4/ 100
METRIC RATING
95th/ 347
METRIC RANK
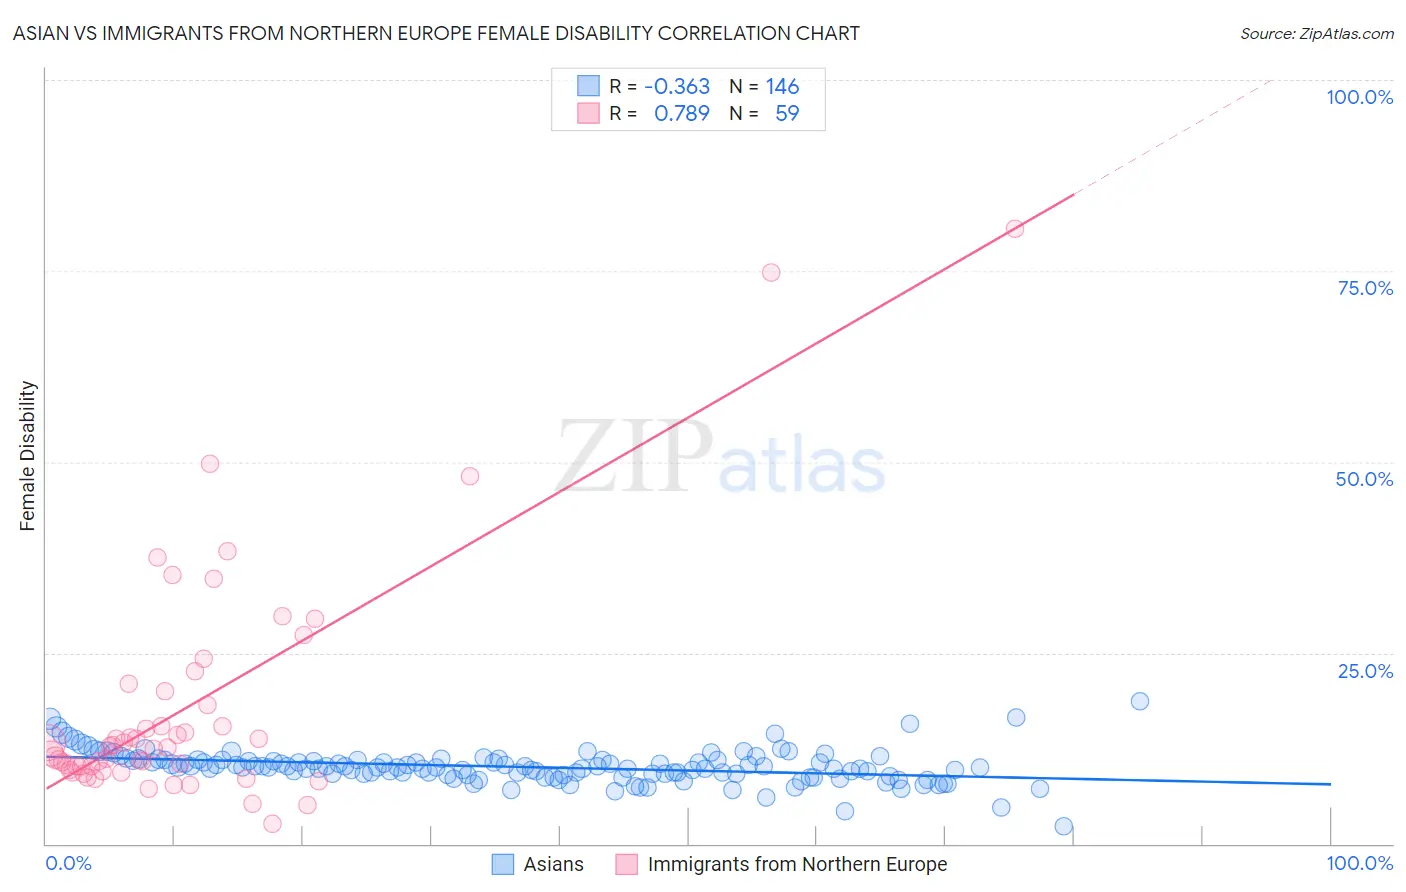
Asian vs Immigrants from Northern Europe Female Disability Correlation Chart
The statistical analysis conducted on geographies consisting of 550,713,500 people shows a mild negative correlation between the proportion of Asians and percentage of females with a disability in the United States with a correlation coefficient (R) of -0.363 and weighted average of 10.9%. Similarly, the statistical analysis conducted on geographies consisting of 477,174,714 people shows a strong positive correlation between the proportion of Immigrants from Northern Europe and percentage of females with a disability in the United States with a correlation coefficient (R) of 0.789 and weighted average of 11.6%, a difference of 6.4%.
Female Disability Correlation Summary
| Measurement | Asian | Immigrants from Northern Europe |
| Minimum | 2.3% | 2.6% |
| Maximum | 18.7% | 80.5% |
| Range | 16.4% | 77.9% |
| Mean | 10.1% | 17.9% |
| Median | 10.0% | 12.6% |
| Interquartile 25% (IQ1) | 9.0% | 9.7% |
| Interquartile 75% (IQ3) | 11.0% | 19.9% |
| Interquartile Range (IQR) | 1.9% | 10.2% |
| Standard Deviation (Sample) | 2.2% | 15.2% |
| Standard Deviation (Population) | 2.1% | 15.1% |
Similar Demographics by Female Disability
Demographics Similar to Asians by Female Disability
In terms of female disability, the demographic groups most similar to Asians are Immigrants from Sri Lanka (10.9%, a difference of 0.13%), Venezuelan (11.0%, a difference of 0.35%), Immigrants from Pakistan (10.9%, a difference of 0.36%), Immigrants from Venezuela (10.9%, a difference of 0.54%), and Immigrants from Iran (10.8%, a difference of 0.75%).
| Demographics | Rating | Rank | Female Disability |
| Immigrants | China | 100.0 /100 | #14 | Exceptional 10.7% |
| Burmese | 100.0 /100 | #15 | Exceptional 10.7% |
| Okinawans | 100.0 /100 | #16 | Exceptional 10.8% |
| Indians (Asian) | 100.0 /100 | #17 | Exceptional 10.8% |
| Immigrants | Iran | 100.0 /100 | #18 | Exceptional 10.8% |
| Immigrants | Venezuela | 100.0 /100 | #19 | Exceptional 10.9% |
| Immigrants | Pakistan | 100.0 /100 | #20 | Exceptional 10.9% |
| Asians | 100.0 /100 | #21 | Exceptional 10.9% |
| Immigrants | Sri Lanka | 100.0 /100 | #22 | Exceptional 10.9% |
| Venezuelans | 100.0 /100 | #23 | Exceptional 11.0% |
| Immigrants | Argentina | 100.0 /100 | #24 | Exceptional 11.0% |
| Immigrants | Asia | 100.0 /100 | #25 | Exceptional 11.0% |
| Argentineans | 100.0 /100 | #26 | Exceptional 11.0% |
| Immigrants | Turkey | 100.0 /100 | #27 | Exceptional 11.1% |
| Egyptians | 100.0 /100 | #28 | Exceptional 11.1% |
Demographics Similar to Immigrants from Northern Europe by Female Disability
In terms of female disability, the demographic groups most similar to Immigrants from Northern Europe are Immigrants from Brazil (11.6%, a difference of 0.070%), Immigrants from Sierra Leone (11.6%, a difference of 0.10%), Immigrants from Czechoslovakia (11.6%, a difference of 0.20%), Immigrants from Romania (11.6%, a difference of 0.21%), and Immigrants from Zimbabwe (11.6%, a difference of 0.21%).
| Demographics | Rating | Rank | Female Disability |
| Yup'ik | 99.5 /100 | #88 | Exceptional 11.6% |
| Vietnamese | 99.5 /100 | #89 | Exceptional 11.6% |
| Immigrants | Romania | 99.5 /100 | #90 | Exceptional 11.6% |
| Immigrants | Zimbabwe | 99.5 /100 | #91 | Exceptional 11.6% |
| Immigrants | Czechoslovakia | 99.5 /100 | #92 | Exceptional 11.6% |
| Immigrants | Sierra Leone | 99.4 /100 | #93 | Exceptional 11.6% |
| Immigrants | Brazil | 99.4 /100 | #94 | Exceptional 11.6% |
| Immigrants | Northern Europe | 99.4 /100 | #95 | Exceptional 11.6% |
| Immigrants | Russia | 99.0 /100 | #96 | Exceptional 11.7% |
| Koreans | 99.0 /100 | #97 | Exceptional 11.7% |
| Uruguayans | 98.8 /100 | #98 | Exceptional 11.7% |
| Immigrants | Philippines | 98.6 /100 | #99 | Exceptional 11.7% |
| Immigrants | Uruguay | 98.5 /100 | #100 | Exceptional 11.7% |
| Immigrants | Costa Rica | 98.4 /100 | #101 | Exceptional 11.7% |
| Immigrants | South Eastern Asia | 98.4 /100 | #102 | Exceptional 11.7% |